Anime Datasets EDA

Contents
1. Introduction
In this notebook we will explore the datasets scraped by our webscraping scripts. A previous notebook going through these scripts can be found here. Exploration in this notebook will be guided by some key questions within each section.
import pandas as pd
import numpy as np
from ast import literal_eval
import seaborn as sns
import matplotlib.pyplot as plt
import warnings
import statsmodels as sm
warnings.filterwarnings('ignore')
2. Anime Info Dataset EDA
In this section we will look at the dataset containing information for the 13,300 titles scraped, guided by the following questions:
- How many episodes does a title usually run for?
- Longest running titles?
- Best performing studios?
- Number of titles released over the years
- How are titles scored?
First we will look at some general information from this dataset.
cleaned_df = pd.read_csv('cleaned_anime_info.csv')
cleaned_df['Aired_Start'] = pd.to_datetime(cleaned_df['Aired_Start'], errors='coerce')
cleaned_df['Aired_End'] = pd.to_datetime(cleaned_df['Aired_End'], errors='coerce')
cleaned_df.head()
| MAL_Id | Name | Type | Episodes | Status | Producers | Licensors | Studios | Source | Genres | ... | Score-2 | Score-1 | Synopsis | Voice_Actors | Recommended_Ids | Recommended_Counts | Aired_Start | Aired_End | Premiered_Season | Rank | |
|---|---|---|---|---|---|---|---|---|---|---|---|---|---|---|---|---|---|---|---|---|---|
| 0 | 52991 | Sousou no Frieren | TV | 28.0 | Finished Airing | ['Aniplex', 'Dentsu', 'Shogakukan-Shueisha Pro... | ['None found', 'add some'] | ['Madhouse'] | Manga | ['Adventure', 'Drama', 'Fantasy', 'Shounen'] | ... | 402 | 4100 | During their decade-long quest to defeat the D... | ['Tanezaki, Atsumi', 'Ichinose, Kana', 'Kobaya... | ['33352', '41025', '35851', '486', '457', '296... | ['14', '11', '8', '5', '5', '4', '4', '3', '2'... | 2023-09-29 | 2024-03-22 | 4.0 | 1 |
| 1 | 5114 | Fullmetal Alchemist: Brotherhood | TV | 64.0 | Finished Airing | ['Aniplex', 'Square Enix', 'Mainichi Broadcast... | ['Funimation', 'Aniplex of America'] | ['Bones'] | Manga | ['Action', 'Adventure', 'Drama', 'Fantasy', 'M... | ... | 3460 | 50602 | After a horrific alchemy experiment goes wrong... | ['Park, Romi', 'Kugimiya, Rie', 'Miki, Shinich... | ['11061', '16498', '1482', '38000', '9919', '1... | ['74', '44', '21', '17', '16', '14', '14', '9'... | 2009-04-05 | 2010-07-04 | 2.0 | 2 |
| 2 | 9253 | Steins;Gate | TV | 24.0 | Finished Airing | ['Frontier Works', 'Media Factory', 'Kadokawa ... | ['Funimation'] | ['White Fox'] | Visual novel | ['Drama', 'Sci-Fi', 'Suspense', 'Psychological... | ... | 2868 | 10054 | Eccentric scientist Rintarou Okabe has a never... | ['Miyano, Mamoru', 'Imai, Asami', 'Hanazawa, K... | ['31043', '31240', '9756', '10620', '2236', '4... | ['132', '130', '48', '26', '24', '19', '19', '... | 2011-04-06 | 2011-09-14 | 2.0 | 3 |
| 3 | 28977 | Gintama° | TV | 51.0 | Finished Airing | ['TV Tokyo', 'Aniplex', 'Dentsu'] | ['Funimation', 'Crunchyroll'] | ['Bandai Namco Pictures'] | Manga | ['Action', 'Comedy', 'Sci-Fi', 'Gag Humor', 'H... | ... | 1477 | 8616 | Gintoki, Shinpachi, and Kagura return as the f... | ['Sugita, Tomokazu', 'Kugimiya, Rie', 'Sakaguc... | ['9863', '30276', '33255', '37105', '6347', '3... | ['3', '2', '1', '1', '1', '1', '1', '1', '1', ... | 2015-04-08 | 2016-03-30 | 2.0 | 4 |
| 4 | 38524 | Shingeki no Kyojin Season 3 Part 2 | TV | 10.0 | Finished Airing | ['Production I.G', 'Dentsu', 'Mainichi Broadca... | ['Funimation'] | ['Wit Studio'] | Manga | ['Action', 'Drama', 'Suspense', 'Gore', 'Milit... | ... | 1308 | 12803 | Seeking to restore humanity's diminishing hope... | ['Kamiya, Hiroshi', 'Kaji, Yuuki', 'Ishikawa, ... | ['28623', '37521', '25781', '2904', '36649', '... | ['1', '1', '1', '1', '1', '1', '1', '1', '1', ... | 2019-04-29 | 2019-07-01 | 2.0 | 5 |
5 rows × 40 columns
cleaned_df.info()
<class 'pandas.core.frame.DataFrame'>
RangeIndex: 13300 entries, 0 to 13299
Data columns (total 40 columns):
 #   Column              Non-Null Count  Dtype
---  ------              --------------  -----
 0   MAL_Id              13300 non-null  int64
 1   Name                13300 non-null  object
 2   Type                13300 non-null  object
 3   Episodes            13245 non-null  float64
 4   Status              13300 non-null  object
 5   Producers           13300 non-null  object
 6   Licensors           13300 non-null  object
 7   Studios             13300 non-null  object
 8   Source              13300 non-null  object
 9   Genres              13300 non-null  object
 10  Duration            13300 non-null  object
 11  Rating              13211 non-null  object
 12  Score               13300 non-null  float64
 13  Popularity          13300 non-null  int64
 14  Members             13300 non-null  int64
 15  Favorites           13300 non-null  int64
 16  Watching            13300 non-null  int64
 17  Completed           13300 non-null  int64
 18  On-Hold             13300 non-null  int64
 19  Dropped             13300 non-null  int64
 20  Plan to Watch       13300 non-null  int64
 21  Total               13300 non-null  int64
 22  Score-10            13300 non-null  int64
 23  Score-9             13300 non-null  int64
 24  Score-8             13300 non-null  int64
 25  Score-7             13300 non-null  int64
 26  Score-6             13300 non-null  int64
 27  Score-5             13300 non-null  int64
 28  Score-4             13300 non-null  int64
 29  Score-3             13300 non-null  int64
 30  Score-2             13300 non-null  int64
 31  Score-1             13300 non-null  int64
 32  Synopsis            13300 non-null  object
 33  Voice_Actors        13300 non-null  object
 34  Recommended_Ids     13300 non-null  object
 35  Recommended_Counts  13300 non-null  object
 36  Aired_Start         13289 non-null  datetime64[ns]
 37  Aired_End           7148 non-null   datetime64[ns]
 38  Premiered_Season    13289 non-null  float64
 39  Rank                13300 non-null  int64
dtypes: datetime64[ns](2), float64(3), int64(21), object(14)
memory usage: 4.1+ MB
Here we notice some missing values from ‘Episodes’,’Rating’,’Aired_Start’,’Aired_End’,’Premiered_Season’.
cleaned_df.describe()
| MAL_Id | Episodes | Score | Popularity | Members | Favorites | Watching | Completed | On-Hold | Dropped | ... | Score-6 | Score-5 | Score-4 | Score-3 | Score-2 | Score-1 | Aired_Start | Aired_End | Premiered_Season | Rank | |
|---|---|---|---|---|---|---|---|---|---|---|---|---|---|---|---|---|---|---|---|---|---|
| count | 13300.000000 | 13245.000000 | 13300.000000 | 13300.000000 | 1.330000e+04 | 13300.000000 | 1.330000e+04 | 1.330000e+04 | 13300.000000 | 13300.000000 | ... | 13300.000000 | 13300.000000 | 13300.000000 | 13300.000000 | 13300.000000 | 13300.000000 | 13289 | 7148 | 13289.000000 | 13300.000000 |
| mean | 22248.567669 | 13.740506 | 6.456092 | 7936.567744 | 7.285031e+04 | 854.796466 | 4.751001e+03 | 4.703889e+04 | 1878.256692 | 2406.951579 | ... | 3976.735940 | 1944.259549 | 868.131654 | 396.392707 | 229.843383 | 252.029925 | 2007-03-30 05:47:17.685303552 | 2010-01-27 17:09:50.263010816 | 2.432764 | 6650.500000 |
| min | 1.000000 | 1.000000 | 1.869653 | 1.000000 | 1.240000e+02 | 0.000000 | 4.000000e+00 | 0.000000e+00 | 0.000000 | 7.000000 | ... | 1.000000 | 1.000000 | 0.000000 | 0.000000 | 0.000000 | 0.000000 | 1917-01-01 00:00:00 | 1962-02-25 00:00:00 | 1.000000 | 1.000000 |
| 25% | 5004.250000 | 1.000000 | 5.827480 | 3411.750000 | 1.418000e+03 | 1.000000 | 7.000000e+01 | 5.840000e+02 | 35.000000 | 89.000000 | ... | 81.000000 | 71.000000 | 32.000000 | 18.000000 | 11.000000 | 20.000000 | 2001-05-10 00:00:00 | 2004-06-21 12:00:00 | 1.000000 | 3325.750000 |
| 50% | 20850.000000 | 3.000000 | 6.548627 | 7537.500000 | 6.592000e+03 | 10.000000 | 2.770000e+02 | 3.199000e+03 | 144.000000 | 183.000000 | ... | 461.000000 | 275.000000 | 109.000000 | 55.000000 | 32.000000 | 41.000000 | 2011-07-30 00:00:00 | 2013-06-21 12:00:00 | 2.000000 | 6650.500000 |
| 75% | 37095.250000 | 13.000000 | 7.205349 | 12211.000000 | 4.213000e+04 | 100.000000 | 1.722000e+03 | 2.288675e+04 | 839.000000 | 892.250000 | ... | 2709.000000 | 1364.250000 | 528.250000 | 240.000000 | 133.000000 | 140.000000 | 2017-10-03 00:00:00 | 2018-12-07 18:00:00 | 3.000000 | 9975.250000 |
| max | 58592.000000 | 3057.000000 | 9.276142 | 21779.000000 | 3.928648e+06 | 225215.000000 | 1.658868e+06 | 3.445820e+06 | 277825.000000 | 218766.000000 | ... | 269758.000000 | 173778.000000 | 110044.000000 | 58187.000000 | 33200.000000 | 50602.000000 | 2024-04-08 00:00:00 | 2024-04-27 00:00:00 | 4.000000 | 13300.000000 |
| std | 17416.784305 | 52.926585 | 1.027267 | 5098.692655 | 2.210112e+05 | 6223.221896 | 2.238497e+04 | 1.636013e+05 | 7004.696705 | 7893.897702 | ... | 11176.487076 | 5544.392422 | 2974.903574 | 1483.749934 | 949.186809 | 1180.692242 | NaN | NaN | 1.124617 | 3839.523625 |
8 rows × 26 columns
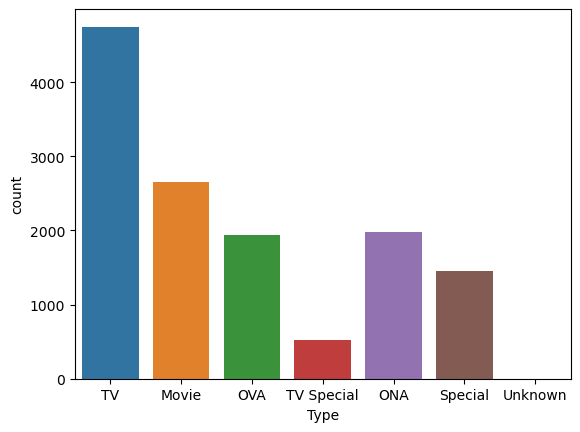
2.1 How many episodes does a title usually run for?
sns.countplot(data=cleaned_df, x='Type')
<Axes: xlabel='Type', ylabel='count'>
cleaned_df[(cleaned_df.Type=='TV')]['Episodes'].describe()
count    4715.000000
mean       31.006575
std        84.461690
min         2.000000
25%        12.000000
50%        13.000000
75%        26.000000
max      3057.000000
Name: Episodes, dtype: float64
cleaned_df[(cleaned_df.Type!='TV')]['Episodes'].describe()
count    8530.000000
mean        4.196600
std        12.289696
min         1.000000
25%         1.000000
50%         1.000000
75%         3.000000
max       496.000000
Name: Episodes, dtype: float64
Within “Type” TV series is the largest category, for the other categories we see that a majority of them are a one time thing with a single episode so we will be focusing on the TV category for this section
sns.histplot(data=cleaned_df[(cleaned_df.Type=='TV')&(cleaned_df.Episodes<=30)], x='Episodes', bins=30, binrange=(0,30))
plt.title('Distribution of No. of Episodes (TV Titles <= 30 Episodes)')
Text(0.5, 1.0, 'Distribution of No. of Episodes (TV Titles <= 30 Episodes)')
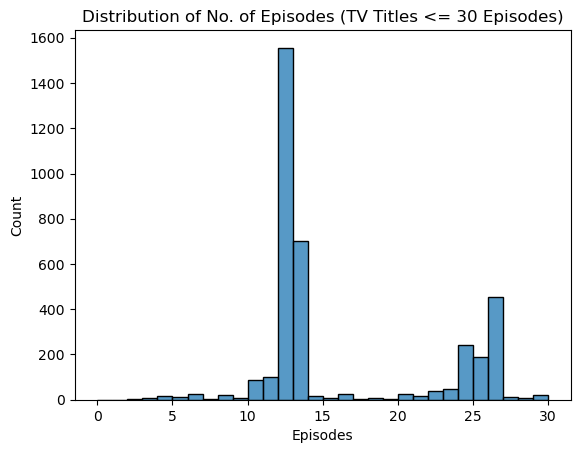
For TV series with <= 30 Episodes, the most popular run length is 12 episodes long, followed by 13 and 26 episode lengths.
sns.histplot(data=cleaned_df[(cleaned_df.Type=='TV')&(cleaned_df.Episodes>30)&(cleaned_df.Episodes<=250)], x='Episodes', bins=22, binrange=(30,250))
plt.title('Distribution of No. of Episodes (TV Titles 30 < Episodes <= 250)')
Text(0.5, 1.0, 'Distribution of No. of Episodes (TV Titles 30 < Episodes <= 250)')
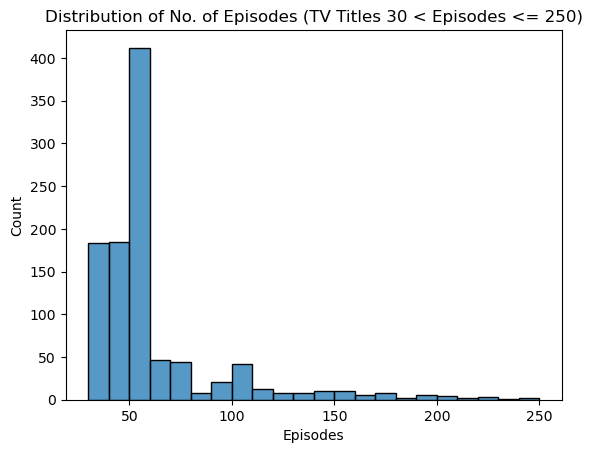
Looking at titles with 30 < Eipsodes <= 250, most fall within the 50 to 60 episodes range, followed by 40 to 50 and 30 to 40 episodes.
sns.histplot(data=cleaned_df[(cleaned_df.Type=='TV')&(cleaned_df.Episodes>250)], x='Episodes', bins=26, binrange=(250,3500))
plt.title('Distribution of No. of Episodes (TV Titles 250 > Episodes)')
Text(0.5, 1.0, 'Distribution of No. of Episodes (TV Titles 250 > Episodes)')
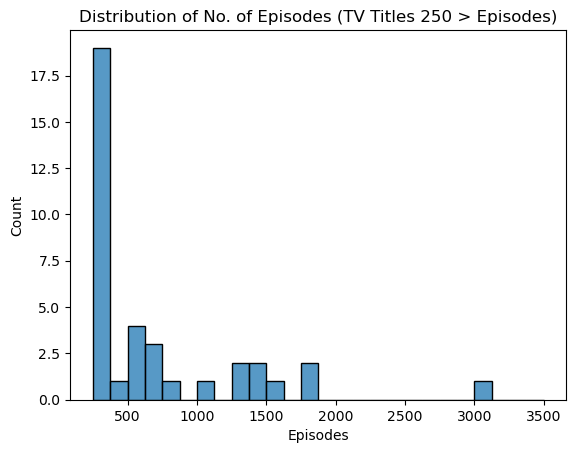
Looking at the outlier long running titles we see that most fall between 250 to 500 episodes, with an outlier running for more than 3000 episodes!
cleaned_df[cleaned_df.Episodes > 1000][['MAL_Id','Name','Episodes','Status','Popularity','Score','Rank','Aired_Start','Aired_End']]
| MAL_Id | Name | Episodes | Status | Popularity | Score | Rank | Aired_Start | Aired_End | |
|---|---|---|---|---|---|---|---|---|---|
| 904 | 2471 | Doraemon (1979) | 1787.0 | Finished Airing | 2737 | 7.765135 | 905 | 1979-04-02 | 2005-03-18 |
| 6897 | 6277 | Manga Nippon Mukashibanashi (1976) | 1471.0 | Finished Airing | 11722 | 6.415709 | 6898 | 1976-01-07 | 1994-09-03 |
| 9028 | 9947 | Lan Mao | 3057.0 | Finished Airing | 13932 | 5.680556 | 9029 | 1999-10-08 | 2001-08-01 |
| 10202 | 8213 | Hokahoka Kazoku | 1428.0 | Finished Airing | 13747 | 5.657343 | 10203 | 1976-10-01 | 1982-03-31 |
| 10271 | 32448 | Kirin Ashita no Calendar | 1306.0 | Finished Airing | 15099 | 5.510000 | 10272 | 1980-01-01 | 1984-10-06 |
| 10709 | 22221 | Monoshiri Daigaku: Ashita no Calendar | 1274.0 | Finished Airing | 14150 | 5.542986 | 10710 | 1966-07-01 | 1970-08-02 |
| 11038 | 10241 | Sekai Monoshiri Ryoko | 1006.0 | Finished Airing | 14208 | 5.642553 | 11039 | 1971-10-01 | 1974-12-31 |
| 11256 | 23349 | Kirin Monoshiri Yakata | 1565.0 | Finished Airing | 14288 | 5.335740 | 11257 | 1975-01-01 | 1979-12-31 |
| 11641 | 12393 | Oyako Club | 1818.0 | Finished Airing | 12922 | 5.518605 | 11642 | 1994-10-03 | 2013-03-30 |
Above are the outlier titles with the highest number of episodes! Interestingly, except for Doraemon it seems like none of the titles are particularly highly rated or popular.
2.2 Longest running titles?
cleaned_df.Status.value_counts()
Status
Finished Airing     13197
Currently Airing      103
Name: count, dtype: int64
currently_airing = cleaned_df[cleaned_df.Status=='Currently Airing']
sns.histplot(currently_airing, x='Aired_Start')
plt.title("Currently Airing Titles' Premier Years")
Text(0.5, 1.0, "Currently Airing Titles' Premier Years")
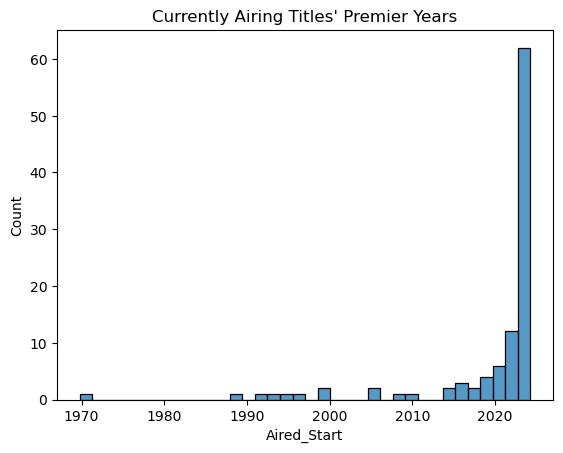
Looking at titles that are still running, we see that the majority of them premiered in the 2020s as expected. The oldest running title appears to be from around 1970, more than 50 years ago!
currently_airing[currently_airing['Aired_Start'].dt.year < 2000][['MAL_Id','Name','Episodes','Status','Score','Popularity','Rank','Aired_Start']]
| MAL_Id | Name | Episodes | Status | Score | Popularity | Rank | Aired_Start | |
|---|---|---|---|---|---|---|---|---|
| 51 | 21 | One Piece | NaN | Currently Airing | 8.741164 | 19 | 52 | 1999-10-20 |
| 405 | 235 | Meitantei Conan | NaN | Currently Airing | 8.196769 | 675 | 406 | 1996-01-08 |
| 997 | 966 | Crayon Shin-chan | NaN | Currently Airing | 7.840472 | 2313 | 998 | 1992-04-13 |
| 2602 | 6149 | Chibi Maruko-chan (1995) | NaN | Currently Airing | 7.409741 | 7834 | 2603 | 1995-01-08 |
| 3751 | 1199 | Nintama Rantarou | NaN | Currently Airing | 7.207432 | 7119 | 3752 | 1993-04-10 |
| 5304 | 1960 | Sore Ike! Anpanman | NaN | Currently Airing | 6.892672 | 9096 | 5305 | 1988-10-03 |
| 7489 | 4459 | Ojarumaru | NaN | Currently Airing | 6.338290 | 11094 | 7490 | 1998-10-05 |
| 8878 | 2406 | Sazae-san | NaN | Currently Airing | 6.185860 | 6857 | 8879 | 1969-10-05 |
Above are titles that starting airing before 2000 and are still airing today, It appears that for these titles the Episodes field is empty as there is no known end date/episode. Compared to the previous section where we looked at aired titles with the highest number of episodes, these titles are more popular and higher rated in general, with very recognizable names like One Piece, Detective Conan, and Crayon Shin-chan within the list.
cleaned_df.iloc[8878]
MAL_Id                                                             2406
Name                                                          Sazae-san
Type                                                                 TV
Episodes                                                            NaN
Status                                                 Currently Airing
Producers                                                   ['Fuji TV']
Licensors                                    ['None found', 'add some']
Studios                                                       ['Eiken']
Source                                                     4-koma manga
Genres                                      ['Comedy', 'Slice of Life']
Duration                                                        24 min.
Rating                                                     G - All Ages
Score                                                           6.18586
Popularity                                                         6857
Members                                                            8369
Favorites                                                            37
Watching                                                           2171
Completed                                                             1
On-Hold                                                             741
Dropped                                                            1826
Plan to Watch                                                      3630
Total                                                              8369
Score-10                                                            248
Score-9                                                              97
Score-8                                                             180
Score-7                                                             354
Score-6                                                             353
Score-5                                                             266
Score-4                                                             101
Score-3                                                              55
Score-2                                                              48
Score-1                                                             165
Synopsis              The main character is a mother named Sazae-san...
Voice_Actors          ['Katou, Midori', 'Nagai, Ichiro', 'Sasuga, Ta...
Recommended_Ids                                 ['951', '6149', '6625']
Recommended_Counts                                      ['1', '1', '1']
Aired_Start                                         1969-10-05 00:00:00
Aired_End                                                           NaT
Premiered_Season                                                    4.0
Rank                                                               8879
Name: 8878, dtype: object
Looking at the oldest currently airing title named Sazae-san, apparently it has aired more than 8000 episodes thus far! This is more episodes than the highest number we have seen in this dataset (3057 episodes), however as the title is still airing with no planned ending, the final episode count is listed as Unknown on the website.
2.3 Best performing studios?
studios = cleaned_df.copy()
studios.Studios
0                           ['Madhouse']
1                              ['Bones']
2                          ['White Fox']
3              ['Bandai Namco Pictures']
4                         ['Wit Studio']
                      ...
13295       ['Toei Animation', 'Gallop']
13296    ['Production I.G', 'Signal.MD']
13297                            ['OLM']
13298                 ['Toei Animation']
13299         ['None found', 'add some']
Name: Studios, Length: 13300, dtype: object
# evaluate the Studios column as a list of strings
studios['Studios'] = studios['Studios'].apply(literal_eval)
# explode the studios column to make multiple entries for titles with multiple studios, one try for each studio
studios = studios.explode('Studios')
studios.Studios.value_counts()
Studios
None found                           2219
add some                             2219
Toei Animation                        735
Sunrise                               509
J.C.Staff                             386
                                     ...
uzupiyo Animation & Digital Works       1
VROOOOM                                 1
Mook DLE                                1
Studio Korumi                           1
Anime Tokyo                             1
Name: count, Length: 812, dtype: int64
We see that Toei Animation has worked on the highest number of titles, 2219 titles have missing studios information
studios.Studios.value_counts().describe()
count     812.000000
mean       20.418719
std       119.205020
min         1.000000
25%         1.000000
50%         3.000000
75%         9.000000
max      2219.000000
Name: count, dtype: float64
# Remove entries with unknown studios
studios = studios[(~studios.Studios.str.contains('add some|None found'))]
Distribution of Number of Titles per Studio
num_titles = studios.Studios.value_counts().reset_index()
num_titles.head()
| Studios | count | |
|---|---|---|
| 0 | Toei Animation | 735 |
| 1 | Sunrise | 509 |
| 2 | J.C.Staff | 386 |
| 3 | Madhouse | 351 |
| 4 | Production I.G | 317 |
print("Number of Studios with only 1 title : ", len(num_titles[num_titles['count'] == 1]))
print("Number of Studios with 2~5 titles : ", len(num_titles[(num_titles['count']<=5)&(num_titles['count']>=2)]))
print("Number of Studios with >5 titles : ", len(num_titles[num_titles['count'] >5] ))
Number of Studios with only 1 title :  253
Number of Studios with 2~5 titles :  285
Number of Studios with >5 titles :  272
More than 2/3 of Studios are attributed to <= 5 titles
ax = sns.histplot(num_titles[num_titles['count'] >5], x='count', bins=50)
ax.set(xlabel='Number of Titles', ylabel='Number of Studios')
plt.title('Distribution of Number of Titles per Studio (with >5 Titles)')
Text(0.5, 1.0, 'Distribution of Number of Titles per Studio (with >5 Titles)')
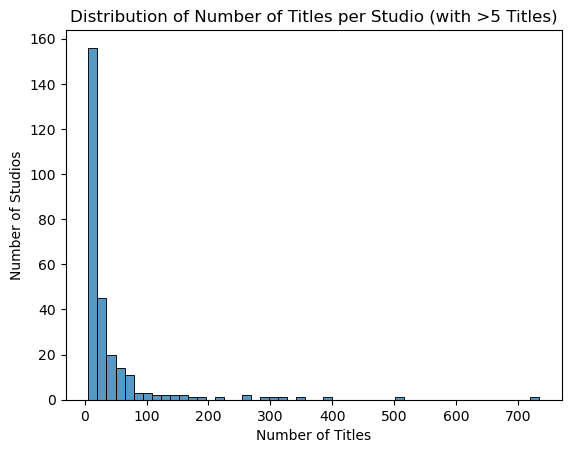
Looking at studios with >5 titles, most fall under 100 titles. However some larger/longer standing studios have more than 300 titles attributed to them.
Distribution of Average Score per Studio
avg_score = studios.groupby('Studios')['Score'].mean().reset_index()
avg_score
| Studios | Score | |
|---|---|---|
| 0 | 10Gauge | 6.800447 |
| 1 | 2:10 AM Animation | 6.439553 |
| 2 | 5 Inc. | 5.997731 |
| 3 | 7doc | 6.157123 |
| 4 | 81 Produce | 5.324742 |
| ... | ... | ... |
| 805 | team Yamahitsuji | 7.286680 |
| 806 | teamKG | 6.011747 |
| 807 | ufotable | 7.209364 |
| 808 | uzupiyo Animation & Digital Works | 6.049351 |
| 809 | yell | 4.593171 |
810 rows × 2 columns
ax = sns.histplot(avg_score, x='Score')
ax.set(xlabel='Average Score')

quantiles = ['25%','50%','75%']
colors = ['red','orange','green']
for i in range(len(quantiles)):
    a = avg_score.describe().transpose()[quantiles[i]]['Score']
    ax.axvline(a, color=colors[i], label=f'Q{i+1} : {a:.2f}')
plt.legend()
plt.title('Distribution of Average Scores of the Studios')
Text(0.5, 1.0, 'Distribution of Average Scores of the Studios')
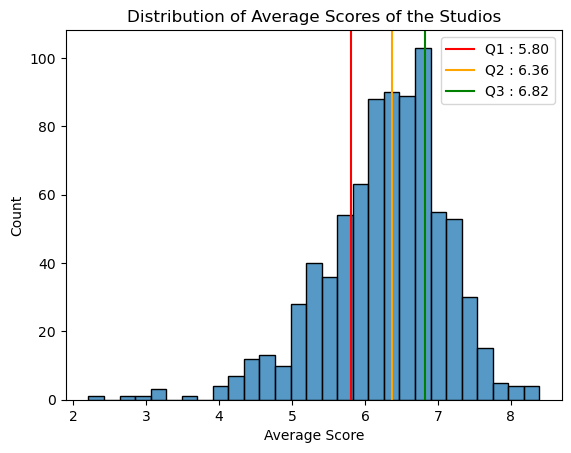
Most studios have an average score between 5.80 to 6.82
studios_agg = studios.groupby('Studios')['Score'].agg(['count','mean']).reset_index().sort_values('count', ascending=False)
studios_agg[:10]
| Studios | count | mean | |
|---|---|---|---|
| 706 | Toei Animation | 735 | 6.646888 |
| 668 | Sunrise | 509 | 6.857137 |
| 295 | J.C.Staff | 386 | 6.805965 |
| 371 | Madhouse | 351 | 6.955988 |
| 483 | Production I.G | 317 | 7.041709 |
| 678 | TMS Entertainment | 306 | 6.945850 |
| 599 | Studio Deen | 291 | 6.930208 |
| 467 | Pierrot | 263 | 6.790359 |
| 424 | OLM | 261 | 6.630814 |
| 6 | A-1 Pictures | 219 | 7.158236 |
print(f"The top 10 studios has worked on {studios_agg[:10]['count'].sum() * 100 / studios_agg['count'].sum():.2f}% of all titles in the dataset")
The top 10 studios has worked on 29.96% of all titles in the dataset
fig,ax = plt.subplots(2,1)
sns.barplot(studios_agg[:10], x='Studios', y='count', ax=ax[0])
sns.barplot(studios_agg[:10], x='Studios', y='mean', ax=ax[1])
ax[0].set(ylabel='Number of Titles')
ax[0].get_xaxis().set_visible(False)
ax[0].set_ylim(bottom = studios_agg[:10]['count'].min()-20, top = studios_agg[:10]['count'].max()+20)
ax[1].set(ylabel='Mean Score')
ax[1].set_ylim(bottom = studios_agg[:10]['mean'].min()-0.5, top = studios_agg[:10]['mean'].max()+0.5)
ax[1].set_xticklabels(ax[1].get_xticklabels(), rotation=45, ha='right')

quantiles = ['50%','75%']
colors = ['orange','green']
for i in range(len(quantiles)):
    a = avg_score.describe().transpose()[quantiles[i]]['Score']
    ax[1].axhline(a, color=colors[i], label=f'Q{i+2} : {a:.2f}')
fig.legend(loc='center right')
fig.suptitle('Number of Titles/Mean Scores of the Top 10 Largest Studios')
fig.tight_layout()
fig.show()
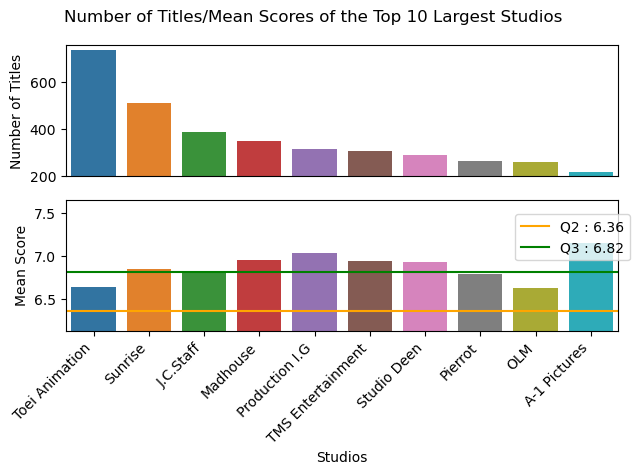
All the top studios have average scores better than the median of the industry, a few of them such as Production I.G and A-1 Pictures have average scores better than the 75% percentile of the industry.
studios_agg.sort_values('mean', ascending=False)[:10]
| Studios | count | mean | |
|---|---|---|---|
| 419 | Nippon Ramayana Film Co. | 1 | 8.390935 |
| 733 | TthunDer Animation | 1 | 8.326316 |
| 186 | Egg Firm | 4 | 8.251246 |
| 306 | K-Factory | 3 | 8.187644 |
| 546 | Shenman Entertainment | 3 | 8.105867 |
| 584 | Studio Bind | 7 | 8.100353 |
| 543 | Sharefun Studio | 4 | 8.085452 |
| 651 | Studio Signpost | 5 | 7.979743 |
| 13 | AHA Entertainment | 2 | 7.956859 |
| 179 | E&H Production | 2 | 7.898461 |
cleaned_df[cleaned_df.Studios.str.contains('Nippon Ramayana Film Co.')]
| MAL_Id | Name | Type | Episodes | Status | Producers | Licensors | Studios | Source | Genres | ... | Score-2 | Score-1 | Synopsis | Voice_Actors | Recommended_Ids | Recommended_Counts | Aired_Start | Aired_End | Premiered_Season | Rank | |
|---|---|---|---|---|---|---|---|---|---|---|---|---|---|---|---|---|---|---|---|---|---|
| 208 | 4921 | Ramayana: The Legend of Prince Rama | Movie | 1.0 | Finished Airing | ['TEM Co.', 'Ltd.'] | ['None found', 'add some'] | ['Nippon Ramayana Film Co.'] | Other | ['Adventure'] | ... | 21 | 69 | Rama, the eldest prince of the Kingdom of Ayod... | [] | ['40834', '249'] | ['1', '1'] | 1993-01-15 | NaT | 1.0 | 209 |
1 rows × 40 columns
The studio with the highest mean score has only 1 title as shown above, looks like it was a production studio set up specifically to produce the Ramayana Movie.
studios_agg[studios_agg['count'] >= 10].sort_values('mean', ascending=False)[:10]
| Studios | count | mean | |
|---|---|---|---|
| 402 | Motion Magic | 12 | 7.681899 |
| 49 | Animation Do | 10 | 7.649636 |
| 554 | Shuka | 19 | 7.604989 |
| 337 | Kyoto Animation | 116 | 7.458863 |
| 762 | Wonder Cat Animation | 10 | 7.443068 |
| 158 | David Production | 42 | 7.377500 |
| 759 | Wit Studio | 68 | 7.360997 |
| 682 | TROYCA | 18 | 7.357247 |
| 102 | Bones | 146 | 7.318575 |
| 127 | CloverWorks | 48 | 7.306971 |
When looking at studios that have worked on >=10 titles, Motion Magic appears to have the highest average score. Some notable studios in the above list are Kyoto ANimation, Wit Studio, and Bones with >50 titles and a high average score suggesting that they have a really good track record of producing well rated titles.
2.4 Number of anime titles over the years
sns.histplot(cleaned_df.Aired_Start.dt.year, bins = 50)
<Axes: xlabel='Aired_Start', ylabel='Count'>
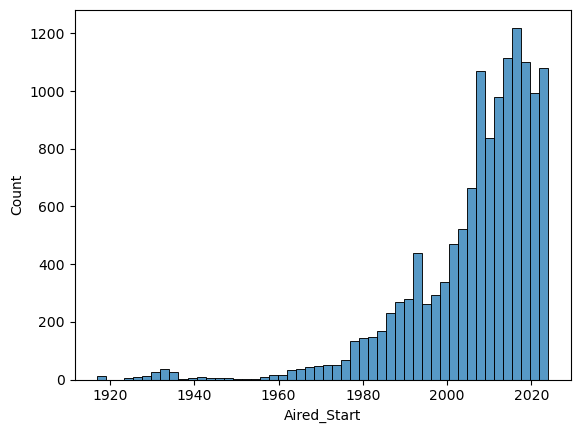
From the above plot we see the number of titles being producted plummeted around 1930s~1960s, possibly due to WW2 and its aftermath. Since then it have been increasing, with a boom since the 2000s. In recent years ~500 titles are released every year compared to the ~100 at year 2000.
cleaned_df.Aired_Start.dt.year.value_counts().iloc[:10]
Aired_Start
2016.0    617
2017.0    603
2018.0    592
2014.0    583
2015.0    533
2021.0    533
2019.0    510
2022.0    494
2012.0    494
2013.0    487
Name: count, dtype: int64
The top 10 years with the highest number of titles released are all from between 2010 and now.
2.5 How are titles scored?
scores = cleaned_df[cleaned_df.columns[12:32]].copy()
scores['MAL_Id'] = cleaned_df['MAL_Id'].copy()
scores['Name'] = cleaned_df['Name'].copy()
scores['Rank'] = cleaned_df['Rank'].copy()
scores['Popularity'] = cleaned_df['Popularity'].copy()
scores['Episodes'] = cleaned_df['Episodes'].copy()
scores.head()
| Score | Popularity | Members | Favorites | Watching | Completed | On-Hold | Dropped | Plan to Watch | Total | ... | Score-6 | Score-5 | Score-4 | Score-3 | Score-2 | Score-1 | MAL_Id | Name | Rank | Episodes | |
|---|---|---|---|---|---|---|---|---|---|---|---|---|---|---|---|---|---|---|---|---|---|
| 0 | 9.276142 | 301 | 670859 | 35435 | 256405 | 241747 | 9365 | 6223 | 157119 | 670859 | ... | 3191 | 1726 | 734 | 426 | 402 | 4100 | 52991 | Sousou no Frieren | 1 | 28.0 |
| 1 | 8.941080 | 3 | 3331144 | 225215 | 258128 | 2407536 | 112339 | 58874 | 494267 | 3331144 | ... | 31930 | 15538 | 5656 | 2763 | 3460 | 50602 | 5114 | Fullmetal Alchemist: Brotherhood | 2 | 64.0 |
| 2 | 8.962588 | 13 | 2553356 | 189031 | 166881 | 1601623 | 88990 | 55596 | 640266 | 2553356 | ... | 31520 | 16580 | 8023 | 3740 | 2868 | 10054 | 9253 | Steins;Gate | 3 | 24.0 |
| 3 | 8.726812 | 341 | 628071 | 16610 | 68383 | 262806 | 24425 | 18685 | 253772 | 628071 | ... | 6060 | 3601 | 1496 | 1011 | 1477 | 8616 | 28977 | Gintama° | 4 | 51.0 |
| 4 | 9.019487 | 21 | 2262916 | 58383 | 79195 | 2037246 | 9242 | 7393 | 129840 | 2262916 | ... | 22287 | 8112 | 3186 | 1596 | 1308 | 12803 | 38524 | Shingeki no Kyojin Season 3 Part 2 | 5 | 10.0 |
5 rows × 24 columns
ax = sns.histplot(scores, x='Score')

quantiles = ['25%','50%','75%']
colors = ['red','orange','green']
for i in range(len(quantiles)):
    a = scores.describe().transpose()[quantiles[i]]['Score']
    ax.axvline(a, color=colors[i], label=f'Q{i+1} : {a:.2f}')
plt.legend()
plt.title('Distribution of Scores Across All Titles')
Text(0.5, 1.0, 'Distribution of Scores Across All Titles')
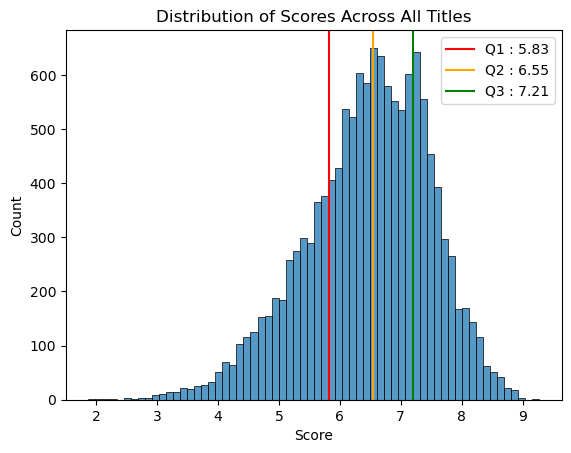
Looking at the distribution of scores for all titles we see that most scores fall between 5.83~7.21.
The distribution suggests that users are not using the entire scale, rather than a 1-10 rating system it looks more like a 4-10 system with 6/7 being an “average” rating.
Next we can try looking at the deviation of scores to see which are the more polarizing titles according to user ratings.
def calc_sd(data):
    #MAD = (summ |xi - xmean|) / n
    n = 0
    total = 0
    xmean = 0
    xdiff = 0
    for i in range(1,11):
        col = 'Score-' + str(i)
        total += data[col] * int(i)
        n += data[col]

    xmean = total/n

    for i in range(1,11):
        col = 'Score-' + str(i)
        xdiff += (abs(int(i)-xmean) ** 2) * data[col]
    return (xdiff/n) ** 0.5
scores['SD'] = scores.apply(calc_sd, axis=1)
scores['SD']
0        1.361661
1        1.674361
2        1.430520
3        2.009090
4        1.289965
           ...
13295    3.203730
13296    1.950239
13297    2.841099
13298    2.860655
13299    3.108680
Name: SD, Length: 13300, dtype: float64
scores[['Name','Rank','Score','SD','Popularity']].sort_values('SD', ascending = False)[:10]
| Name | Rank | Score | SD | Popularity | |
|---|---|---|---|---|---|
| 13288 | Shin Yaranai ka | 13289 | 6.631579 | 3.615908 | 10908 |
| 13159 | Chicken Papa | 13160 | 4.150509 | 3.381850 | 10311 |
| 12363 | Uobbuchou | 12364 | 4.731707 | 3.325372 | 18258 |
| 11684 | Kenda Master Ken (TV) | 11685 | 5.150235 | 3.323831 | 13899 |
| 10645 | Mahou no LumiTear | 10646 | 7.172691 | 3.320603 | 14605 |
| 10853 | Yousei Dick | 10854 | 5.659574 | 3.316795 | 14295 |
| 12335 | Yodel no Onna | 12336 | 5.741093 | 3.316546 | 12113 |
| 11676 | Burutabu-chan | 11677 | 4.396694 | 3.296578 | 18372 |
| 13015 | Chargeman Ken! | 13016 | 4.353383 | 3.259139 | 8821 |
| 10239 | Xiong Chumo: Xiong Zin Guilai | 10240 | 4.469027 | 3.256228 | 18319 |
score_cols = ['Score-10', 'Score-9',
       'Score-8', 'Score-7', 'Score-6', 'Score-5', 'Score-4', 'Score-3',
       'Score-2', 'Score-1'][::-1]
ax = sns.barplot(scores[scores['Rank']==13016][score_cols])
ax.set_xticklabels(score_cols, rotation=45, ha='right')
[Text(0, 0, 'Score-1'),
 Text(1, 0, 'Score-2'),
 Text(2, 0, 'Score-3'),
 Text(3, 0, 'Score-4'),
 Text(4, 0, 'Score-5'),
 Text(5, 0, 'Score-6'),
 Text(6, 0, 'Score-7'),
 Text(7, 0, 'Score-8'),
 Text(8, 0, 'Score-9'),
 Text(9, 0, 'Score-10')]
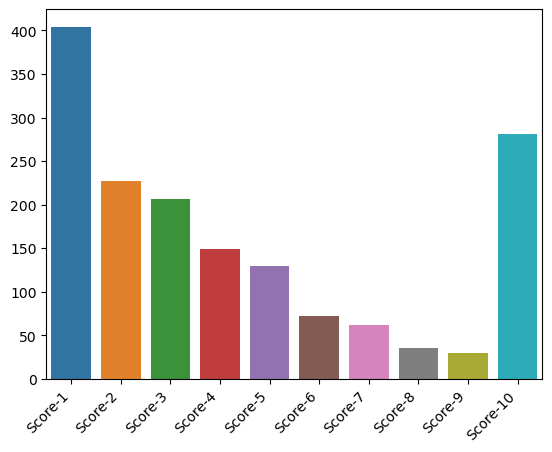
scores[scores['Rank']==13016][score_cols]
| Score-1 | Score-2 | Score-3 | Score-4 | Score-5 | Score-6 | Score-7 | Score-8 | Score-9 | Score-10 | |
|---|---|---|---|---|---|---|---|---|---|---|
| 13015 | 404 | 227 | 206 | 149 | 130 | 72 | 62 | 35 | 30 | 281 |
Looks like Titles with the largest score deviation are generally lower scoring titles with lower popularity. Possibly due to the lower number of user votes and obscurity of the title, the title will be dominated by scores at both ends of the 1-10 scale rather than the centre/one end of the scale as one would expect.
scores[['Name','Rank','Score','SD','Popularity']].loc[scores['Rank'] < 300].sort_values('SD', ascending = False)[:10]
| Name | Rank | Score | SD | Popularity | |
|---|---|---|---|---|---|
| 9 | Ginga Eiyuu Densetsu | 10 | 8.647633 | 2.177381 | 745 |
| 49 | Ashita no Joe 2 | 50 | 8.380418 | 2.172501 | 3045 |
| 5 | Gintama: The Final | 6 | 8.862701 | 2.126664 | 1538 |
| 3 | Gintama° | 4 | 8.726812 | 2.009090 | 341 |
| 272 | Blue Archive the Animation | 273 | 8.379562 | 1.946342 | 4056 |
| 143 | Mo Dao Zu Shi: Wanjie Pian | 144 | 8.427876 | 1.929255 | 2377 |
| 160 | Gintama: Yorinuki Gintama-san on Theater 2D | 161 | 8.295726 | 1.914696 | 3306 |
| 139 | Aria the Origination | 140 | 8.325882 | 1.849753 | 1725 |
| 227 | Tian Guan Cifu Special | 228 | 8.325569 | 1.834084 | 3157 |
| 208 | Ramayana: The Legend of Prince Rama | 209 | 8.390935 | 1.804288 | 6079 |
score_cols = ['Score-10', 'Score-9',
       'Score-8', 'Score-7', 'Score-6', 'Score-5', 'Score-4', 'Score-3',
       'Score-2', 'Score-1'][::-1]
ax = sns.barplot(scores[scores['Rank']==10][score_cols])
ax.set_xticklabels(score_cols, rotation=45, ha='right')
[Text(0, 0, 'Score-1'),
 Text(1, 0, 'Score-2'),
 Text(2, 0, 'Score-3'),
 Text(3, 0, 'Score-4'),
 Text(4, 0, 'Score-5'),
 Text(5, 0, 'Score-6'),
 Text(6, 0, 'Score-7'),
 Text(7, 0, 'Score-8'),
 Text(8, 0, 'Score-9'),
 Text(9, 0, 'Score-10')]
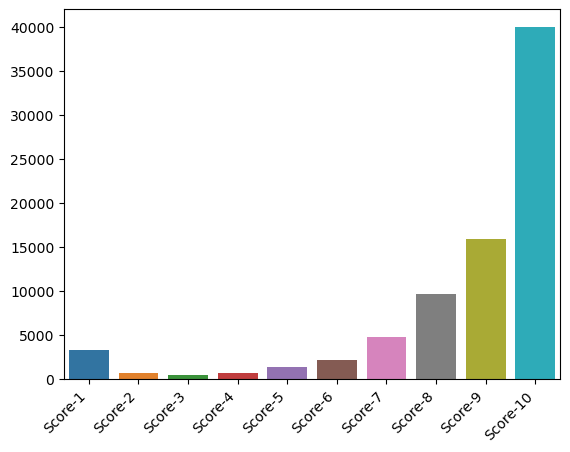
Looking at only the Top 300 titles we see the highest standard deviation of scores is significantly lower at ~2.18. Compared to the previous title, we see that this title appears to be universally well acclaimed with a large amount of perfect scores. The variance in scores appear to be driven up by a sizeable subset of users giving it a score of 1.
scores['PauseWatchRatio'] = (scores['Dropped']+scores['On-Hold'])/(scores['Completed']+scores['Watching'])
scores[['Rank','Name','Score','Episodes','PauseWatchRatio','Popularity']].iloc[:100].sort_values('PauseWatchRatio', ascending=False)[:10]
| Rank | Name | Score | Episodes | PauseWatchRatio | Popularity | |
|---|---|---|---|---|---|---|
| 14 | 15 | Gintama | 8.616600 | 201.0 | 0.332894 | 139 |
| 51 | 52 | One Piece | 8.741164 | NaN | 0.280334 | 19 |
| 9 | 10 | Ginga Eiyuu Densetsu | 8.647633 | 110.0 | 0.268197 | 745 |
| 69 | 70 | Mushishi | 8.542181 | 26.0 | 0.219599 | 215 |
| 24 | 25 | Monster | 8.753179 | 74.0 | 0.209530 | 133 |
| 99 | 100 | Shouwa Genroku Rakugo Shinjuu | 8.477288 | 13.0 | 0.170704 | 833 |
| 57 | 58 | Great Teacher Onizuka | 8.611780 | 43.0 | 0.137601 | 218 |
| 3 | 4 | Gintama° | 8.726812 | 51.0 | 0.130167 | 341 |
| 45 | 46 | Cowboy Bebop | 8.710319 | 26.0 | 0.119984 | 43 |
| 50 | 51 | Shouwa Genroku Rakugo Shinjuu: Sukeroku Futata... | 8.608779 | 12.0 | 0.114479 | 1272 |
Within the top 100 titles, when comparing the ratio of users who have dropped/paused the title vs those who have completed/currently-watching, the top three titles with the highest ratio of watchers abandoning the show all have a high number of episodes with approximately 1/3 ~ 1/4 of watchers abandoning it partway. One Piece has more than 1000 episodes as of 2024.
Even though these titles are highly rated and generally high in popularity, it appears that the length of a series is a factor in whether a user watches a titles completely.
sns.heatmap(scores.iloc[:100].corr(numeric_only=True), mask = np.triu(scores.iloc[:100].corr(numeric_only=True)))
<Axes: >
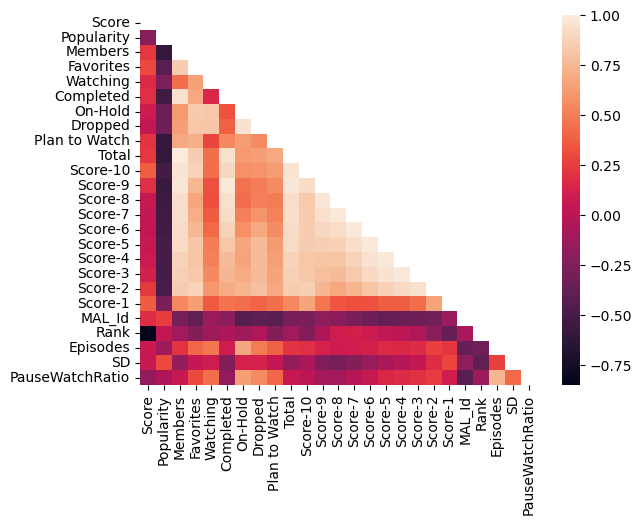
Looking at the heatmap above for the top 100 titles, it looks like number of Episodes is indeed linearly correlated with PauseWatchRatio. Another interesting observation is that a title’s average score is correlated to the number of Score-1 that it has received, suggesting that highly rated titles may be bombarded by Score-1 ratings for whatever reason.
sns.heatmap(cleaned_df.corr(numeric_only=True), mask = np.triu(cleaned_df.corr(numeric_only=True)), cmap='icefire')
<Axes: >
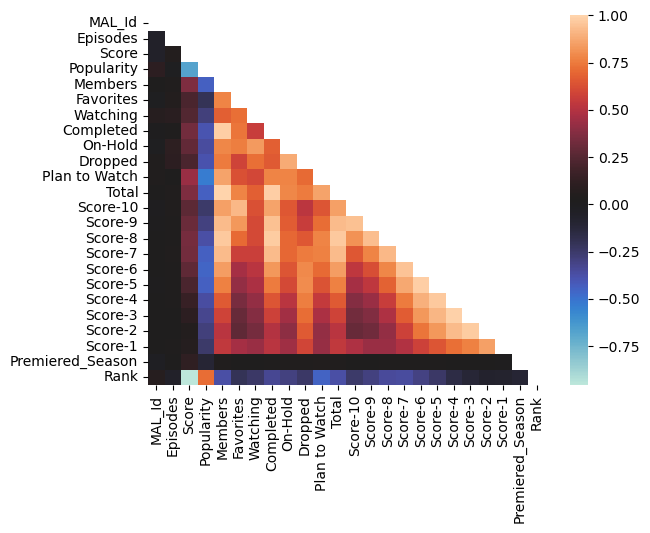
Above we see a correlation heatmap of the variables within our dataset, with many observations that aligns with what one would commonly expect. Titles’ ratings/popularity are correlated the number of times they get added to a user’s to-watch list.
3. Anime Reviews Dataset EDA
df = pd.read_csv('cleaned_anime_reviews.csv')
df2 = df.merge(cleaned_df[['MAL_Id','Name','Type','Episodes','Status','Source','Aired_Start','Aired_End','Rank']])
df2
| review_id | MAL_Id | Review | Tags | Name | Type | Episodes | Status | Source | Aired_Start | Aired_End | Rank | |
|---|---|---|---|---|---|---|---|---|---|---|---|---|
| 0 | 0 | 52991 | With lives so short, why do we even bother? To... | Recommended | Sousou no Frieren | TV | 28.0 | Finished Airing | Manga | 2023-09-29 | 2024-03-22 | 1 |
| 1 | 0 | 52991 | With lives so short, why do we even bother? To... | Preliminary | Sousou no Frieren | TV | 28.0 | Finished Airing | Manga | 2023-09-29 | 2024-03-22 | 1 |
| 2 | 1 | 52991 | Frieren is the most overrated anime of this de... | Not-Recommended | Sousou no Frieren | TV | 28.0 | Finished Airing | Manga | 2023-09-29 | 2024-03-22 | 1 |
| 3 | 1 | 52991 | Frieren is the most overrated anime of this de... | Funny | Sousou no Frieren | TV | 28.0 | Finished Airing | Manga | 2023-09-29 | 2024-03-22 | 1 |
| 4 | 1 | 52991 | Frieren is the most overrated anime of this de... | Preliminary | Sousou no Frieren | TV | 28.0 | Finished Airing | Manga | 2023-09-29 | 2024-03-22 | 1 |
| ... | ... | ... | ... | ... | ... | ... | ... | ... | ... | ... | ... | ... |
| 92327 | 77912 | 3287 | Anime is and always has been, a great story te... | Not-Recommended | Tenkuu Danzai Skelter+Heaven | OVA | 1.0 | Finished Airing | Visual novel | 2004-12-08 | NaT | 13284 |
| 92328 | 77913 | 3287 | If you've come to watch a piece of trash, then... | Not-Recommended | Tenkuu Danzai Skelter+Heaven | OVA | 1.0 | Finished Airing | Visual novel | 2004-12-08 | NaT | 13284 |
| 92329 | 77914 | 3287 | Giant Sqid Thingy is muh waifu Before there wa... | Recommended | Tenkuu Danzai Skelter+Heaven | OVA | 1.0 | Finished Airing | Visual novel | 2004-12-08 | NaT | 13284 |
| 92330 | 77915 | 3287 | "It is not the fault of the product. It depend... | Recommended | Tenkuu Danzai Skelter+Heaven | OVA | 1.0 | Finished Airing | Visual novel | 2004-12-08 | NaT | 13284 |
| 92331 | 77916 | 3287 | "Tenkuu Danzai Skelter+Heaven" is a thrilling ... | Recommended | Tenkuu Danzai Skelter+Heaven | OVA | 1.0 | Finished Airing | Visual novel | 2004-12-08 | NaT | 13284 |
92332 rows × 12 columns
df2.groupby('MAL_Id')['review_id'].nunique().value_counts()
review_id
20    2257
1     2004
2     1141
3      777
4      575
5      397
6      321
7      262
8      239
9      177
10     170
12     133
11     127
14     114
13     114
15     102
17      89
16      79
18      71
19      66
Name: count, dtype: int64
The max number of reviews for any title within the dataset appears to be 20 as the source scrapes only the first page of reviews for every title.
print(f"Titles with at least a full page of reviews: {(df2.groupby('MAL_Id')['review_id'].nunique() == 20).sum()} / {len(df2.groupby('MAL_Id')['review_id'].nunique())} titles")
Titles with at least a full page of reviews: 2257 / 9215 titles
# Count length of each review
df2['review_length'] = df2.Review.apply(len)
df2['review_length'].head()
0    3381
1    3381
2    1458
3    1458
4    1458
Name: review_length, dtype: int64
# collate unique review per MAL id
review_len = df2.groupby('MAL_Id')['review_id'].unique().reset_index()
review_len.head()
| MAL_Id | review_id | |
|---|---|---|
| 0 | 1 | [892, 893, 894, 895, 896, 897, 898, 899, 900, ... |
| 1 | 5 | [3486, 3487, 3488, 3489, 3490, 3491, 3492, 349... |
| 2 | 6 | [6023, 6024, 6025, 6026, 6027, 6028, 6029, 603... |
| 3 | 7 | [37039, 37040, 37041, 37042, 37043, 37044, 370... |
| 4 | 8 | [48684, 48685, 48686, 48687] |
def sum_reviews(data, ref=df2):
    reviews_len = 0
    for num in data['review_id']:
        reviews_len += ref.loc[ref.review_id == num]['review_length'].values[0]
    return reviews_len
# Total length of all reviews per MAL Id
review_len['total_review_length'] = review_len.apply(sum_reviews, axis=1)
review_len.head()
| MAL_Id | review_id | total_review_length | |
|---|---|---|---|
| 0 | 1 | [892, 893, 894, 895, 896, 897, 898, 899, 900, ... | 112849 |
| 1 | 5 | [3486, 3487, 3488, 3489, 3490, 3491, 3492, 349... | 54635 |
| 2 | 6 | [6023, 6024, 6025, 6026, 6027, 6028, 6029, 603... | 93273 |
| 3 | 7 | [37039, 37040, 37041, 37042, 37043, 37044, 370... | 47901 |
| 4 | 8 | [48684, 48685, 48686, 48687] | 5808 |
review_len = review_len.merge(cleaned_df[['MAL_Id','Name','Rank']], how = 'left')
review_len = review_len.merge(df2.groupby('MAL_Id')['Tags'].value_counts().unstack().reset_index(), how = 'left')
review_len.head()
| MAL_Id | review_id | total_review_length | Name | Rank | Creative | Funny | Informative | Mixed-Feelings | Not-Recommended | Preliminary | Recommended | Well-written | |
|---|---|---|---|---|---|---|---|---|---|---|---|---|---|
| 0 | 1 | [892, 893, 894, 895, 896, 897, 898, 899, 900, ... | 112849 | Cowboy Bebop | 46 | NaN | NaN | NaN | 2.0 | 3.0 | 1.0 | 15.0 | NaN |
| 1 | 5 | [3486, 3487, 3488, 3489, 3490, 3491, 3492, 349... | 54635 | Cowboy Bebop: Tengoku no Tobira | 191 | NaN | NaN | NaN | 3.0 | 1.0 | NaN | 16.0 | NaN |
| 2 | 6 | [6023, 6024, 6025, 6026, 6027, 6028, 6029, 603... | 93273 | Trigun | 347 | NaN | NaN | NaN | 2.0 | 2.0 | 1.0 | 16.0 | NaN |
| 3 | 7 | [37039, 37040, 37041, 37042, 37043, 37044, 370... | 47901 | Witch Hunter Robin | 3035 | NaN | NaN | NaN | 2.0 | 3.0 | 1.0 | 15.0 | NaN |
| 4 | 8 | [48684, 48685, 48686, 48687] | 5808 | Bouken Ou Beet | 4538 | NaN | NaN | NaN | 1.0 | NaN | NaN | 3.0 | NaN |
review_len.sort_values('total_review_length', ascending=False)[:10]
| MAL_Id | review_id | total_review_length | Name | Rank | Creative | Funny | Informative | Mixed-Feelings | Not-Recommended | Preliminary | Recommended | Well-written | |
|---|---|---|---|---|---|---|---|---|---|---|---|---|---|
| 4164 | 11061 | [120, 121, 122, 123, 124, 125, 126, 127, 128, ... | 204133 | Hunter x Hunter (2011) | 7 | NaN | NaN | NaN | 2.0 | 4.0 | 1.0 | 14.0 | NaN |
| 693 | 820 | [180, 181, 182, 183, 184, 185, 186, 187, 188, ... | 190299 | Ginga Eiyuu Densetsu | 10 | NaN | NaN | NaN | 4.0 | 3.0 | 3.0 | 13.0 | NaN |
| 6815 | 35849 | [38696, 38697, 38698, 38699, 38700, 38701, 387... | 184702 | Darling in the FranXX | 3229 | NaN | NaN | NaN | 1.0 | 8.0 | 10.0 | 11.0 | NaN |
| 5823 | 31043 | [4564, 4565, 4566, 4567, 4568, 4569, 4570, 457... | 164640 | Boku dake ga Inai Machi | 257 | NaN | NaN | NaN | 3.0 | 8.0 | 1.0 | 9.0 | NaN |
| 6207 | 32981 | [75369, 75370, 75371, 75372, 75373, 75374, 753... | 158419 | Hand Shakers | 12228 | NaN | NaN | NaN | 2.0 | 14.0 | 9.0 | 4.0 | NaN |
| 5130 | 21881 | [55394, 55395, 55396, 55397, 55398, 55399, 554... | 158184 | Sword Art Online II | 5636 | NaN | NaN | NaN | 4.0 | 8.0 | NaN | 8.0 | NaN |
| 8285 | 45576 | [1222, 1223, 1224, 1225, 1226, 1227, 1228, 122... | 157586 | Mushoku Tensei: Isekai Ittara Honki Dasu Part 2 | 64 | NaN | NaN | NaN | 1.0 | 10.0 | 7.0 | 9.0 | NaN |
| 8766 | 51009 | [540, 541, 542, 543, 544, 545, 546, 547, 548, ... | 156426 | Jujutsu Kaisen 2nd Season | 28 | NaN | 10.0 | NaN | 8.0 | 6.0 | 11.0 | 6.0 | NaN |
| 4075 | 10620 | [29907, 29908, 29909, 29910, 29911, 29912, 299... | 150197 | Mirai Nikki (TV) | 2264 | NaN | NaN | NaN | 3.0 | 9.0 | 2.0 | 8.0 | NaN |
| 4880 | 18679 | [9774, 9775, 9776, 9777, 9778, 9779, 9780, 978... | 147220 | Kill la Kill | 588 | NaN | NaN | NaN | 4.0 | 3.0 | NaN | 13.0 | NaN |
Hunter X Hunter (2011) has the longest reviews in the first page with a total of over 200,000 characters!
tmp = (df2.groupby('MAL_Id')['review_id'].nunique() == 20).reset_index()
tmp = tmp[tmp['review_id'] == True]['MAL_Id'].values
review_len[review_len['MAL_Id'].isin(tmp)].shape
(2257, 13)
ax = sns.histplot(review_len[review_len['MAL_Id'].isin(tmp)], x='total_review_length')
quantiles = ['25%','50%','75%']
colors = ['red','orange','green']
for i in range(len(quantiles)):
    a = review_len[review_len['MAL_Id'].isin(tmp)].describe()['total_review_length'].transpose()[quantiles[i]]
    ax.axvline(a, color=colors[i], label=f'Q{i+1} : {a:.2f}')
plt.legend()
plt.title('Distribution of Total Review Length (Titles with Full First Page of Reviews)')
Text(0.5, 1.0, 'Distribution of Total Review Length (Titles with Full First Page of Reviews)')
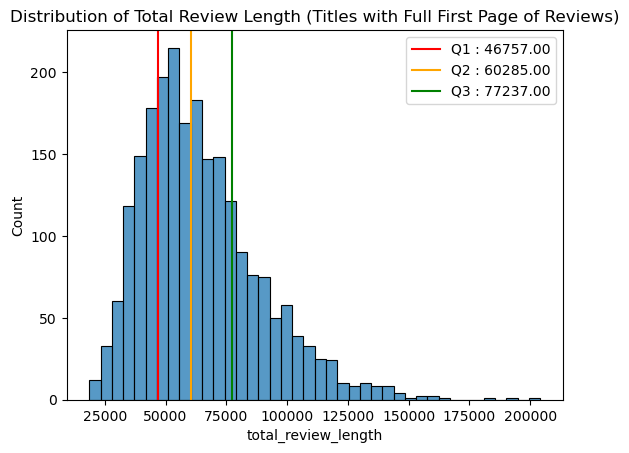
Most titles with a filled first page have between 47000 to 77000 total review characters on the first page.
4. User Ratings Dataset EDA
In the final section we will be exploring the user ratings dataset guided by the following questions
- Average number of titles on a user’s list?
- Average number of lists a title is added to?
- Is this dataset representative of the population data?
df = pd.read_csv('cleaned_user_ratings.csv')
df
| Username | User_Id | Anime_Id | Anime_Title | Rating_Status | Rating_Score | Num_Epi_Watched | Is_Rewatching | Updated | Start_Date | |
|---|---|---|---|---|---|---|---|---|---|---|
| 0 | flerbz | 0 | 30654 | Ansatsu Kyoushitsu 2nd Season | watching | 0 | 24 | False | 2022-02-26 22:15:01+00:00 | 2022-01-29 |
| 1 | flerbz | 0 | 22789 | Barakamon | dropped | 0 | 2 | False | 2023-01-28 19:03:33+00:00 | 2022-04-06 |
| 2 | flerbz | 0 | 31964 | Boku no Hero Academia | completed | 0 | 13 | False | 2024-03-31 02:10:32+00:00 | 2024-03-30 |
| 3 | flerbz | 0 | 33486 | Boku no Hero Academia 2nd Season | completed | 0 | 25 | False | 2024-03-31 22:32:02+00:00 | 2024-03-30 |
| 4 | flerbz | 0 | 36456 | Boku no Hero Academia 3rd Season | watching | 0 | 24 | False | 2024-04-03 02:08:56+00:00 | 2024-03-31 |
| ... | ... | ... | ... | ... | ... | ... | ... | ... | ... | ... |
| 5452187 | mintcakee | 20010 | 392 | Yuu☆Yuu☆Hakusho | plan_to_watch | 0 | 0 | False | 2023-03-09 13:18:23+00:00 | NaN |
| 5452188 | mintcakee | 20010 | 1246 | Yuugo: Koushounin | plan_to_watch | 0 | 0 | False | 2023-10-23 14:14:44+00:00 | NaN |
| 5452189 | mintcakee | 20010 | 23283 | Zankyou no Terror | plan_to_watch | 0 | 0 | False | 2022-12-29 02:18:00+00:00 | NaN |
| 5452190 | mintcakee | 20010 | 37976 | Zombieland Saga | completed | 7 | 12 | False | 2023-04-24 14:35:42+00:00 | NaN |
| 5452191 | mintcakee | 20010 | 40174 | Zombieland Saga Revenge | completed | 8 | 12 | False | 2023-04-24 14:35:46+00:00 | NaN |
5452192 rows × 10 columns
df.info()
<class 'pandas.core.frame.DataFrame'>
RangeIndex: 5452192 entries, 0 to 5452191
Data columns (total 10 columns):
 #   Column           Dtype
---  ------           -----
 0   Username         object
 1   User_Id          int64
 2   Anime_Id         int64
 3   Anime_Title      object
 4   Rating_Status    object
 5   Rating_Score     int64
 6   Num_Epi_Watched  int64
 7   Is_Rewatching    bool
 8   Updated          object
 9   Start_Date       object
dtypes: bool(1), int64(4), object(5)
memory usage: 379.6+ MB
4.1 Average Number of titles on a user’s list?
print(f'Dataset contains {df.Username.nunique()} unique usernames')
Dataset contains 17513 unique usernames
df.Rating_Status.value_counts()
Rating_Status
completed        3495469
plan_to_watch    1354615
watching          276342
dropped           190743
on_hold           134890
Name: count, dtype: int64
df.Rating_Score.value_counts()
Rating_Score
0     2483410
8      760247
7      697199
9      476260
6      355335
10     331937
5      179752
4       82215
3       40177
2       23248
1       22412
Name: count, dtype: int64
print(f'{(len(df)-df.Rating_Score.value_counts()[0])*100/len(df):.2f}% of the entries in the dataset have not been rated')
54.45% of the entries in the dataset have not been rated
df.groupby('Username').count()['User_Id'].describe()
count    17513.00000
mean       311.32256
std        174.44065
min          1.00000
25%        153.00000
50%        327.00000
75%        499.00000
max        499.00000
Name: User_Id, dtype: float64
ax = sns.histplot(df.groupby('Username').count()[['User_Id']], x='User_Id')
quantiles = ['25%','50%','75%']
colors = ['red','orange','green']
for i in range(len(quantiles)):
    a = df.groupby('Username').count()['User_Id'].describe().transpose()[quantiles[i]]
    ax.axvline(a, color=colors[i], label=f'Q{i+1} : {a:.2f}')
plt.xlabel('Number of Entries in List')
plt.legend()
plt.title('Distribution of Number of Titles in User List')
Text(0.5, 1.0, 'Distribution of Number of Titles in User List')
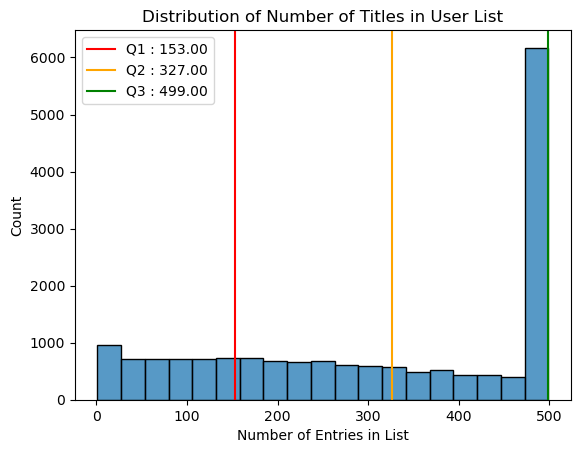
We see that max number of titles in a list is 500, this is due to the webscraping script setting a limit of titles per username to 500, hence the 5000+ usernames with 499 titles in their lists
Within the dataset we see that most users have between 153 to 499 titles in their list.
df
| Username | User_Id | Anime_Id | Anime_Title | Rating_Status | Rating_Score | Num_Epi_Watched | Is_Rewatching | Updated | Start_Date | |
|---|---|---|---|---|---|---|---|---|---|---|
| 0 | flerbz | 0 | 30654 | Ansatsu Kyoushitsu 2nd Season | watching | 0 | 24 | False | 2022-02-26 22:15:01+00:00 | 2022-01-29 |
| 1 | flerbz | 0 | 22789 | Barakamon | dropped | 0 | 2 | False | 2023-01-28 19:03:33+00:00 | 2022-04-06 |
| 2 | flerbz | 0 | 31964 | Boku no Hero Academia | completed | 0 | 13 | False | 2024-03-31 02:10:32+00:00 | 2024-03-30 |
| 3 | flerbz | 0 | 33486 | Boku no Hero Academia 2nd Season | completed | 0 | 25 | False | 2024-03-31 22:32:02+00:00 | 2024-03-30 |
| 4 | flerbz | 0 | 36456 | Boku no Hero Academia 3rd Season | watching | 0 | 24 | False | 2024-04-03 02:08:56+00:00 | 2024-03-31 |
| ... | ... | ... | ... | ... | ... | ... | ... | ... | ... | ... |
| 5452187 | mintcakee | 20010 | 392 | Yuu☆Yuu☆Hakusho | plan_to_watch | 0 | 0 | False | 2023-03-09 13:18:23+00:00 | NaN |
| 5452188 | mintcakee | 20010 | 1246 | Yuugo: Koushounin | plan_to_watch | 0 | 0 | False | 2023-10-23 14:14:44+00:00 | NaN |
| 5452189 | mintcakee | 20010 | 23283 | Zankyou no Terror | plan_to_watch | 0 | 0 | False | 2022-12-29 02:18:00+00:00 | NaN |
| 5452190 | mintcakee | 20010 | 37976 | Zombieland Saga | completed | 7 | 12 | False | 2023-04-24 14:35:42+00:00 | NaN |
| 5452191 | mintcakee | 20010 | 40174 | Zombieland Saga Revenge | completed | 8 | 12 | False | 2023-04-24 14:35:46+00:00 | NaN |
5452192 rows × 10 columns
# Calculate percentage of rated entries in a user's list
df_rated = df[df.Rating_Score != 0].groupby('Username').count()[['User_Id']].reset_index()
df_all = df.groupby('Username').count()['User_Id'].reset_index()
tmp = df_rated.merge(df_all, how = 'left', on ='Username')
tmp['Percentage'] = tmp['User_Id_x']/tmp['User_Id_y']
tmp
| Username | User_Id_x | User_Id_y | Percentage | |
|---|---|---|---|---|
| 0 | ---NovA--- | 343 | 375 | 0.914667 |
| 1 | --0__0-- | 11 | 241 | 0.045643 |
| 2 | --Amaya-- | 198 | 449 | 0.440980 |
| 3 | --Maple-- | 318 | 391 | 0.813299 |
| 4 | --Xerxes-- | 181 | 396 | 0.457071 |
| ... | ... | ... | ... | ... |
| 16149 | zozon | 33 | 499 | 0.066132 |
| 16150 | zsda2 | 282 | 322 | 0.875776 |
| 16151 | zulfikar12 | 130 | 135 | 0.962963 |
| 16152 | zumiyu | 2 | 245 | 0.008163 |
| 16153 | zun43d | 37 | 330 | 0.112121 |
16154 rows × 4 columns
tmp.Percentage.describe()
count    16154.000000
mean         0.585322
std          0.281731
min          0.002004
25%          0.386770
50%          0.627140
75%          0.819888
max          1.000000
Name: Percentage, dtype: float64
ax = sns.histplot(tmp, x='Percentage')
quantiles = ['25%','50%','75%']
colors = ['red','orange','green']
for i in range(len(quantiles)):
    a = tmp.Percentage.describe().transpose()[quantiles[i]]
    ax.axvline(a, color=colors[i], label=f'Q{i+1} : {a:.2f}')
plt.xlabel('Percentage')
plt.legend()
plt.title('Distribution of Percentage of Rated Entries in List')
Text(0.5, 1.0, 'Distribution of Percentage of Rated Entries in List')
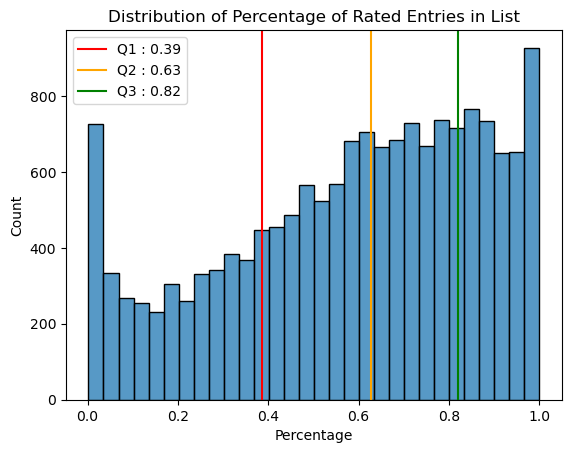
Most users have ~39% to 82% of their entire list rated, more than 700 users have not rated any titles on their list, while more than 900 users have rated every title on their list.
4.2 Average number of lists a title is added to?
title_all = df.groupby('Anime_Title').count()['Anime_Id'].reset_index()
| Anime_Title | Anime_Id | |
|---|---|---|
| 0 | "0" | 23 |
| 1 | "Aesop" no Ohanashi yori: Ushi to Kaeru, Yokub... | 7 |
| 2 | "Ai" wo Taberu | 11 |
| 3 | "Bungaku Shoujo" Kyou no Oyatsu: Hatsukoi | 31 |
| 4 | "Bungaku Shoujo" Memoire | 185 |
| ... | ... | ... |
| 17360 | Üks Uks | 1 |
| 17361 | ēlDLIVE | 488 |
| 17362 | Itsudemo Hohoemi wo | 1 |
| 17363 | Honekko Parade | 5 |
| 17364 | ◯ | 56 |
17365 rows × 2 columns
ax = sns.histplot(title_all, x='Anime_Id', log_scale=True)
quantiles = ['25%','50%','75%']
colors = ['red','orange','green']
for i in range(len(quantiles)):
    a = title_all.Anime_Id.describe().transpose()[quantiles[i]]
    ax.axvline(a, color=colors[i], label=f'Q{i+1} : {a:.2f}')
ax.set(xlabel='Number of Lists Containing Each Unique Title')
plt.legend()
plt.title('Distribution of Percentage of Titles Rated in List')
Text(0.5, 1.0, 'Distribution of Percentage of Titles Rated in List')
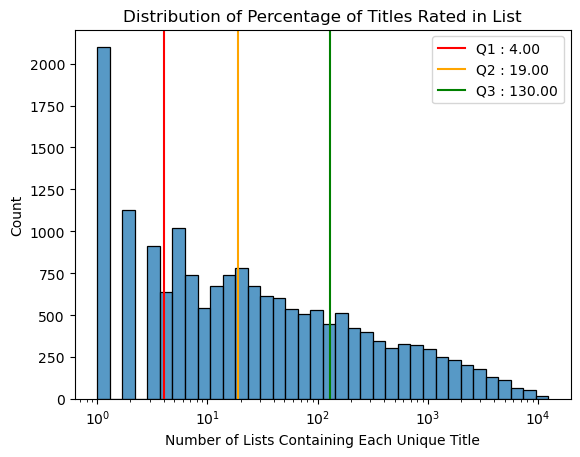
Most titles are added to between 4 and 130 user lists, out of around 17000 unique users we have in the dataset.
title_rated = df[df.Rating_Score != 0].groupby('Anime_Title').count()[['Anime_Id']].reset_index()
title_all = df.groupby('Anime_Title').count()['Anime_Id'].reset_index()
tmp = title_rated.merge(title_all, how = 'left', on ='Anime_Title')
tmp['Percentage'] = tmp['Anime_Id_x']/tmp['Anime_Id_y']
tmp
| Anime_Title | Anime_Id_x | Anime_Id_y | Percentage | |
|---|---|---|---|---|
| 0 | "0" | 17 | 23 | 0.739130 |
| 1 | "Ai" wo Taberu | 6 | 11 | 0.545455 |
| 2 | "Bungaku Shoujo" Kyou no Oyatsu: Hatsukoi | 20 | 31 | 0.645161 |
| 3 | "Bungaku Shoujo" Memoire | 116 | 185 | 0.627027 |
| 4 | "Bungaku Shoujo" Movie | 185 | 300 | 0.616667 |
| ... | ... | ... | ... | ... |
| 14908 | xxxHOLiC Shunmuki | 16 | 65 | 0.246154 |
| 14909 | xxxHOLiC◆Kei | 43 | 146 | 0.294521 |
| 14910 | ēlDLIVE | 219 | 488 | 0.448770 |
| 14911 | Honekko Parade | 2 | 5 | 0.400000 |
| 14912 | ◯ | 42 | 56 | 0.750000 |
14913 rows × 4 columns
ax = sns.histplot(tmp, x='Percentage')
quantiles = ['25%','50%','75%']
colors = ['red','orange','green']
for i in range(len(quantiles)):
    a = tmp.Percentage.describe().transpose()[quantiles[i]]
    ax.axvline(a, color=colors[i], label=f'Q{i+1} : {a:.2f}')
plt.legend()
plt.title('Distribution of Percentage of Titles Rated in List')
Text(0.5, 1.0, 'Distribution of Percentage of Titles Rated in List')
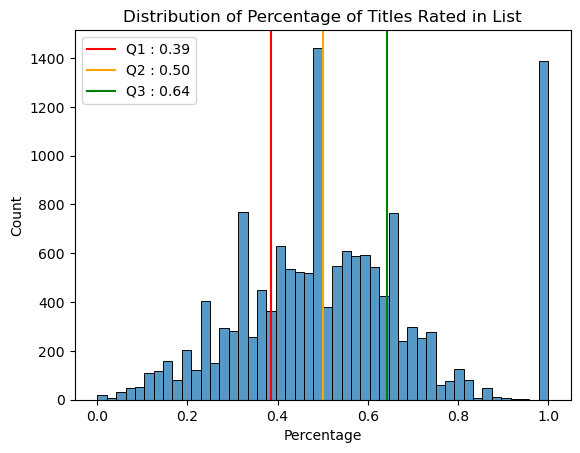
Most titles are rated in 39% to 64% of the lists they are added to. In the plot we see a peak at around 1.0 where 1400 titles have almost 100% rating rate.
tmp[tmp.Percentage > 0.9].sort_values('Anime_Id_y', ascending=False)
| Anime_Title | Anime_Id_x | Anime_Id_y | Percentage | |
|---|---|---|---|---|
| 13241 | Teekyuu 2 Specials | 21 | 22 | 0.954545 |
| 4844 | Generation of Chaos Next: Chikai no Pendant | 20 | 22 | 0.909091 |
| 4068 | Encore | 19 | 21 | 0.904762 |
| 14597 | Youkai Watch Movie 1: Tanjou no Himitsu da Nyan! | 18 | 19 | 0.947368 |
| 9464 | Mera Mera | 14 | 15 | 0.933333 |
| ... | ... | ... | ... | ... |
| 8248 | Kung Fu Gonglyong Suhodae | 1 | 1 | 1.000000 |
| 8257 | Kura Sushi | 1 | 1 | 1.000000 |
| 8285 | Kuroi Ame ni Utarete | 1 | 1 | 1.000000 |
| 8293 | Kurokan | 1 | 1 | 1.000000 |
| 14904 | the FLY BanD! | 1 | 1 | 1.000000 |
1397 rows × 4 columns
tmp[(tmp.Percentage > 0.9)&(tmp.Anime_Id_y == 1)]
| Anime_Title | Anime_Id_x | Anime_Id_y | Percentage | |
|---|---|---|---|---|
| 880 | Anime Nihon no Mukashibanashi | 1 | 1 | 1.0 |
| 923 | Annyeong Jadoo: In-eogongju Pyeon | 1 | 1 | 1.0 |
| 974 | Ao Fei Q Chong | 1 | 1 | 1.0 |
| 1037 | Appa eolil Jeog-en | 1 | 1 | 1.0 |
| 1155 | Arpo The Robot | 1 | 1 | 1.0 |
| ... | ... | ... | ... | ... |
| 14875 | _Summer Specials | 1 | 1 | 1.0 |
| 14898 | loTus feat. Pt. Ajay Pohankar | 1 | 1 | 1.0 |
| 14902 | s.CRY.ed Alteration I: Tao | 1 | 1 | 1.0 |
| 14903 | s.CRY.ed Alteration II: Quan | 1 | 1 | 1.0 |
| 14904 | the FLY BanD! | 1 | 1 | 1.0 |
891 rows × 4 columns
This observation is due to almost 900 titles having only been added to 1 user list, and that entry is also rated. For the remaining 500 titles they are similarly obscure titles where very few users have added them to their lists, and when they appear on a user list they are usually rated.
tmp[(tmp.Percentage < 0.1)]
| Anime_Title | Anime_Id_x | Anime_Id_y | Percentage | |
|---|---|---|---|---|
| 7 | "Eikou Naki Tensai-tachi" Kara no Monogatari | 1 | 12 | 0.083333 |
| 14 | "Oshi no Ko" Season 2 | 1 | 4130 | 0.000242 |
| 20 | "Uchuu Senkan Yamato" to Iu Jidai: Seireki 220... | 6 | 62 | 0.096774 |
| 87 | 11-piki no Neko to Ahoudori | 1 | 13 | 0.076923 |
| 160 | 3-nen D-gumi Glass no Kamen: Tobidase! Watashi... | 1 | 21 | 0.047619 |
| ... | ... | ... | ... | ... |
| 14376 | Xiling Jiyuan | 1 | 18 | 0.055556 |
| 14430 | Yakushiji Ryouko no Kaiki Jikenbo | 1 | 13 | 0.076923 |
| 14522 | Yichang Shengwu Jianwenlu | 3 | 37 | 0.081081 |
| 14816 | Zettai Karen Children | 3 | 33 | 0.090909 |
| 14870 | Zuoshou Shanglan | 2 | 47 | 0.042553 |
139 rows × 4 columns
tmp[(tmp.Percentage < 0.1)&(tmp.Anime_Id_y > 1000)].sort_values('Anime_Id_y', ascending=False)
| Anime_Title | Anime_Id_x | Anime_Id_y | Percentage | |
|---|---|---|---|---|
| 8077 | Kono Subarashii Sekai ni Shukufuku wo! 3 | 369 | 4843 | 0.076192 |
| 7716 | Kimetsu no Yaiba: Hashira Geiko-hen | 58 | 4370 | 0.013272 |
| 14 | "Oshi no Ko" Season 2 | 1 | 4130 | 0.000242 |
| 9877 | Mushoku Tensei II: Isekai Ittara Honki Dasu Pa... | 397 | 4056 | 0.097880 |
| 2008 | Boku no Hero Academia 7th Season | 5 | 3659 | 0.001366 |
| 7144 | Kaijuu 8-gou | 2 | 2862 | 0.000699 |
| 13357 | Tensei shitara Slime Datta Ken 3rd Season | 241 | 2719 | 0.088636 |
| 10572 | One Punch Man 3 | 1 | 2638 | 0.000379 |
| 11483 | Re:Zero kara Hajimeru Isekai Seikatsu 3rd Season | 1 | 2104 | 0.000475 |
| 3336 | Date A Live V | 149 | 1961 | 0.075982 |
| 5396 | Haikyuu!! Movie: Gomisuteba no Kessen | 20 | 1768 | 0.011312 |
| 9001 | Mahouka Koukou no Rettousei 3rd Season | 107 | 1342 | 0.079732 |
| 12860 | Spy x Family Movie: Code: White | 93 | 1300 | 0.071538 |
| 4199 | Fairy Tail: 100 Years Quest | 1 | 1295 | 0.000772 |
| 10683 | Ore dake Level Up na Ken Season 2: Arise from ... | 1 | 1182 | 0.000846 |
| 12018 | Seishun Buta Yarou wa Randoseru Girl no Yume w... | 82 | 1153 | 0.071119 |
| 8332 | Kusuriya no Hitorigoto 2nd Season | 1 | 1118 | 0.000894 |
| 7140 | Kaii to Otome to Kamikakushi | 104 | 1061 | 0.098021 |
At the other end of the spectrum we see a low number of titles with less <0.1 on the plot. Most of these titles appear to be highly anticipated titles that are currently airing or recently released, where users have not managed to complete and rate them.
4.3 Is this dataset representative of the population data?
As our user data contains ratings from a subset of the total user population on the site, we want to check if our data is representative of the site’s rating data.
ax = sns.histplot(df[df.Rating_Score!=0].groupby('Anime_Title')[['Rating_Score']].mean(), x='Rating_Score')
quantiles = ['25%','50%','75%']
colors = ['red','orange','green']
for i in range(len(quantiles)):
    a = df[df.Rating_Score!=0].groupby('Anime_Title')[['Rating_Score']].mean().describe().transpose()[quantiles[i]]['Rating_Score']
    ax.axvline(a, color=colors[i], label=f'Q{i+1} : {a:.2f}')
plt.legend()
plt.title('Distribution of Average Title Scores')
Text(0.5, 1.0, 'Distribution of Average Title Scores')
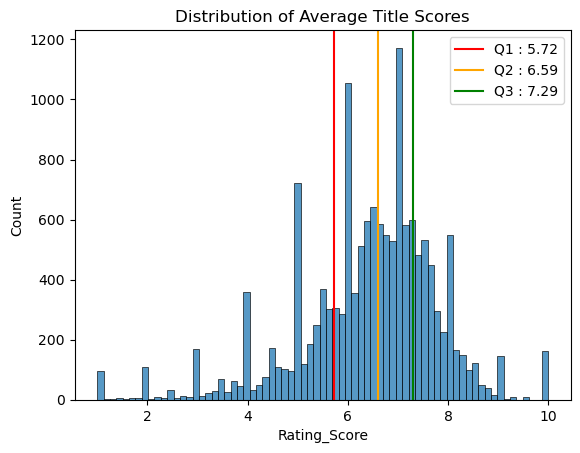
Looking at the distribution of average title scores from our user ratings data, most average scores fall between 5.27 to 7.29. This is fairly close to the site average of 5.83 to 7.21 that we saw previously.
In this distribution we see peaks at every whole number due to obscure titles being added to very few (or a single) list and ending up with a whole number for its average score.
We can also compare the distributions with a student t test to get a more quantitative result.
cleaned_df['Score'].describe()
count    13300.000000
mean         6.456092
std          1.027267
min          1.869653
25%          5.827480
50%          6.548627
75%          7.205349
max          9.276142
Name: Score, dtype: float64
df[df.Rating_Score!=0].groupby('Anime_Title')['Rating_Score'].mean().describe()
count    14913.000000
mean         6.403362
std          1.402710
min          1.000000
25%          5.723404
50%          6.593750
75%          7.291667
max         10.000000
Name: Rating_Score, dtype: float64
scipy.stats.ttest_ind(cleaned_df['Score'].values, df[df.Rating_Score!=0].groupby('Anime_Title')['Rating_Score'].mean().values)
TtestResult(statistic=3.565581711830044, pvalue=0.0003636502206012928, df=28211.0)
sm.stats.weightstats.ztest(cleaned_df['Score'].values, df[df.Rating_Score!=0].groupby('Anime_Title')['Rating_Score'].mean().values)
(3.565581711830044, 0.0003630500223969563)
We see T statistics of 3.56 and p « 0.05, suggesting that the actual population mean is higher than our sample mean. Hence our sample mean is not representative of the population mean.
Some possible reasons as why this might have happened:
- User data was scraped using from users who were active at the time of scraping. If user behaviour when rating titles has changed from the past our sample data will not be able to show these changes. However the data will still be considered in the population mean
- Insufficient samples were scraped, evident from the peaks at the whole numbers. Additional user ratings may need to be scraped to obtain more samples for more obscure titles.
5. Conclusion
In this notebook we have explored the dataset that were scraped from the community site, drawing insights on content attributes, industry behaviour, and user behaviour such as the average user uses only the 4-10 ratings on the 1-10 scale provided.
Some limitations of the data was also identified, most notably the webscraping max limits placed on reviews per title and titles per userlist resulting in incomplete data. The user rating data was also found to not be representative of the site’s average ratings, possibly due to insufficient data collected.
This exploration has provided some insight and intuition around these datasets, allowing us to continue with creating models from these datasets now that we have a better understanding on the data available.