Dirty Data Samples - Cleaning Data With Pandas - Part 2

Contents
- Introduction
- Jumbled Customer Details
- Medicine Data with Combined Quantity and Measure
- Hospital Data with Mixed Numbers and Characters
- Invoices with Merged Categories and Merged Amounts
0. Introduction
In this notebook we will explore 4 “dirty” datasets from a power bi resources website containing poorly recorded data that needs to be rectified. Utilizing pandas we will fix the errors within the dataset so that they are ready for further processing/exploration. The website also shows the final requirements that they want the “clean” dataset to look like, and we will be working with that in mind.
This is part two of two notebooks working with these “dirty” datasets. In Part 1 we have looked at another 4 datasets that contains data that have poorly structured.
import os
import pandas as pd
import numpy as np
files = [f for f in os.listdir('.') if (os.path.isfile(f) and 'xlsx' in f)]
files
['1.-Badly-Structured-Sales-Data-1.xlsx',
 '2.-Badly-Structured-Sales-Data-2.xlsx',
 '3.-Badly-Structured-Sales-Data-3.xlsx',
 '4.-Badly-Structured-Sales-Data-4.xlsx',
 '5.-Jumbled-up-Customers-Details.xlsx',
 '6.-Hospital-Data-with-Mixed-Numbers-and-Characters.xlsx',
 '7.-Medicine-Data-with-lumped-Quantity-and-Measure.xlsx',
 '8.-Invoices-with-Merged-Categories-and-Merged-Amounts.xlsx']
from IPython.core.interactiveshell import InteractiveShell
InteractiveShell.ast_node_interactivity = "all"
1. Jumbled Customer Details
In dataset 5 we will explore a dataset that has all of their values stored in one column. This is encountered often when downloading or copying something from the internet, or when webscraping.
data5 = pd.read_excel('5.-Jumbled-up-Customers-Details.xlsx', header=None)
df = data5.copy()
df = df.rename(columns={0:"Strings"})
df
| Strings | |
|---|---|
| 0 | Name Hussein Hakeem Address Number 22 Fioye Cr... |
| 1 | Name Arojoye Samuel Address 11 Omolade Close O... |
| 2 | Name Alex Ezurum Address 1 Adamu Lane, Abuja A... |
| 3 | Name Susan Nwaimo Address Number 58 Yaba Stree... |
| 4 | Name Ajao Opeyemi Address No12 Olubunmi Street... |
| 5 | Name Banjoko Adebusola Address 34 Ngige Street... |
| 6 | Name Muhammed Olabisi Address 13, ICAN road, E... |
| 7 | Name Oluwagbemi Mojisola Address ACCA Lane, On... |
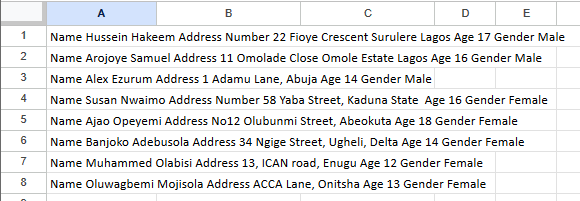
From the above we see that our goal for this dataset is to recognise and separate the original data into their respective columns, to do that we will be making use of regular expression and some pandas functions to transform our data.
pattern = '|'.join(['Name', 'Address','Age','Gender'])
pattern
'Name|Address|Age|Gender'
df['Strings'] = df['Strings'].str.replace(pattern, '|', regex=True)
df.head()
| Strings | |
|---|---|
| 0 | | Hussein Hakeem | Number 22 Fioye Crescent Su... |
| 1 | | Arojoye Samuel | 11 Omolade Close Omole Esta... |
| 2 | | Alex Ezurum | 1 Adamu Lane, Abuja | 14 | Male |
| 3 | | Susan Nwaimo | Number 58 Yaba Street, Kaduna... |
| 4 | | Ajao Opeyemi | No12 Olubunmi Street, Abeokut... |
| Here we have replaced the categories/columns with a | symbol to properly distinguish the different categories in each row of the dataset. |
cleaned_df = pd.DataFrame()
cleaned_df[['na','Name','Address','Age','Gender']] = df['Strings'].str.split('|', expand=True)
cleaned_df
| na | Name | Address | Age | Gender | |
|---|---|---|---|---|---|
| 0 | Hussein Hakeem | Number 22 Fioye Crescent Surulere Lagos | 17 | Male | |
| 1 | Arojoye Samuel | 11 Omolade Close Omole Estate Lagos | 16 | Male | |
| 2 | Alex Ezurum | 1 Adamu Lane, Abuja | 14 | Male | |
| 3 | Susan Nwaimo | Number 58 Yaba Street, Kaduna State | 16 | Female | |
| 4 | Ajao Opeyemi | No12 Olubunmi Street, Abeokuta | 18 | Female | |
| 5 | Banjoko Adebusola | 34 Ngige Street, Ugheli, Delta | 14 | Female | |
| 6 | Muhammed Olabisi | 13, ICAN road, Enugu | 12 | Female | |
| 7 | Oluwagbemi Mojisola | ACCA Lane, Onitsha | 13 | Female |
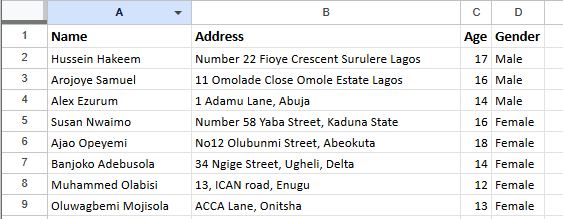
Then we can simply split them into their respective columns achieving our target final state!
2. Medicine Data with Combined Quantity and Measure
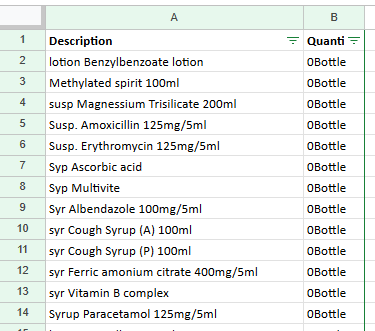
In this dataset we see the “Quantity” column records a mix of quantity and unit measure. Our target final state will be to split this into two columns, to verify that the data cleaning was completed correctly the sum of our final “Quantity” column should be 17600.0.
data6 = pd.read_excel('6.-Hospital-Data-with-Mixed-Numbers-and-Characters.xlsx')
df = data6.copy()
df
| Description | Quantity | |
|---|---|---|
| 0 | lotion Benzylbenzoate lotion | 0Bottle |
| 1 | Methylated spirit 100ml | 0Bottle |
| 2 | susp Magnessium Trisilicate 200ml | 0Bottle |
| 3 | Susp. Amoxicillin 125mg/5ml | 0Bottle |
| 4 | Susp. Erythromycin 125mg/5ml | 0Bottle |
| ... | ... | ... |
| 2274 | Syp Ascorbic acid | 20Bottle |
| 2275 | syr Cough Syrup (P) 100ml | 20Bottle |
| 2276 | syr Cough Syrup (A) 100ml | 10Bottle |
| 2277 | Cotton Wool 100g | 1Pcs |
| 2278 | Disposable gloves | 1Pairs |
2279 rows × 2 columns
cleaned_df = pd.DataFrame()
cleaned_df['Description'] = df['Description']
cleaned_df[['na1','Quantity','na2','Measure','na3']] = df['Quantity'].str.split('(\d+(\.\d*)?)([A-Za-z]+)', expand=True)
cleaned_df = cleaned_df.drop(['na1','na2','na3'], axis=1)
cleaned_df
| Description | Quantity | Measure | |
|---|---|---|---|
| 0 | lotion Benzylbenzoate lotion | 0 | Bottle |
| 1 | Methylated spirit 100ml | 0 | Bottle |
| 2 | susp Magnessium Trisilicate 200ml | 0 | Bottle |
| 3 | Susp. Amoxicillin 125mg/5ml | 0 | Bottle |
| 4 | Susp. Erythromycin 125mg/5ml | 0 | Bottle |
| ... | ... | ... | ... |
| 2274 | Syp Ascorbic acid | 20 | Bottle |
| 2275 | syr Cough Syrup (P) 100ml | 20 | Bottle |
| 2276 | syr Cough Syrup (A) 100ml | 10 | Bottle |
| 2277 | Cotton Wool 100g | 1 | Pcs |
| 2278 | Disposable gloves | 1 | Pairs |
2279 rows × 3 columns
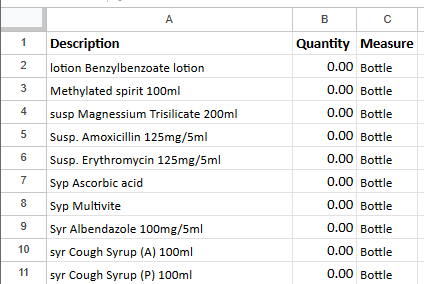
Once again, with the help of regex we managed to split our original “Quantity” column into a column of float quantities “(\d+(.\d*)?)” and a column of alphabetic unit measures “([A-Za-z]+)”.
cleaned_df['Quantity'] = cleaned_df['Quantity'].astype(float).round(2)
cleaned_df.info()
<class 'pandas.core.frame.DataFrame'>
RangeIndex: 2279 entries, 0 to 2278
Data columns (total 3 columns):
 #   Column       Non-Null Count  Dtype
---  ------       --------------  -----
 0   Description  2279 non-null   object
 1   Quantity     2279 non-null   float64
 2   Measure      2279 non-null   object
dtypes: float64(1), object(2)
memory usage: 53.5+ KB
cleaned_df.Quantity.sum()
17600.0
Sanity check after splitting the columns show that non of the rows contain null value, and as expected the sum of the Quantity column is 17600.0.
Below we have a final look at the “cleaned” dataframe and the final state as seen in Google Sheets.
cleaned_df.head()
| Description | Quantity | Measure | |
|---|---|---|---|
| 0 | lotion Benzylbenzoate lotion | 0.0 | Bottle |
| 1 | Methylated spirit 100ml | 0.0 | Bottle |
| 2 | susp Magnessium Trisilicate 200ml | 0.0 | Bottle |
| 3 | Susp. Amoxicillin 125mg/5ml | 0.0 | Bottle |
| 4 | Susp. Erythromycin 125mg/5ml | 0.0 | Bottle |
3. Hospital Data with Mixed Numbers and Characters
In this dataset some of the data has letters used in place of some numbers, our goal would be to identify and convert these letters into their corresponding numbers.
data7 = pd.read_excel('7.-Medicine-Data-with-lumped-Quantity-and-Measure.xlsx')
df = data7.copy()
df
| Description | Basic Unit | Beginning Balance | Quantity Received | Quantity Dispensed | Losses and Adjustments | Ending Balance (Physical Count) | |
|---|---|---|---|---|---|---|---|
| 0 | Tab. Cefuroxime 250mg | 10 | 1000 | 0 | 0 | 0 | 0 |
| 1 | Tab. Cefuroxime 250mg | 10 | 1000 | 0 | 0 | 0 | 0 |
| 2 | Tab. Cefuroxime 250mg | 10 | 1000 | 0 | 0 | 0 | 0 |
| 3 | Cap Ampicillin | 100 | 350 | 0 | 0 | 0 | 0 |
| 4 | Cap Ampicillin | 100 | 350 | 0 | 0 | 0 | 0 |
| ... | ... | ... | ... | ... | ... | ... | ... |
| 5841 | Inj.Vitamin B Complex | Vial | 145 | 30 | 4350 | 0 | 30 |
| 5842 | Insulin (Actrapid) | Vial | 0 | 0 | 0 | 0 | 0 |
| 5843 | Insulin (Insulutard) | Vial | 0 | 2 | 0 | 0 | 2 |
| 5844 | Inj Amoxicillin 500mg | vials | 54 | 100 | 79 | 0 | 75 |
| 5845 | Inj Amoxy/clav 1.2 | vials | 7 | 0 | 7 | 0 | 0 |
5846 rows × 7 columns
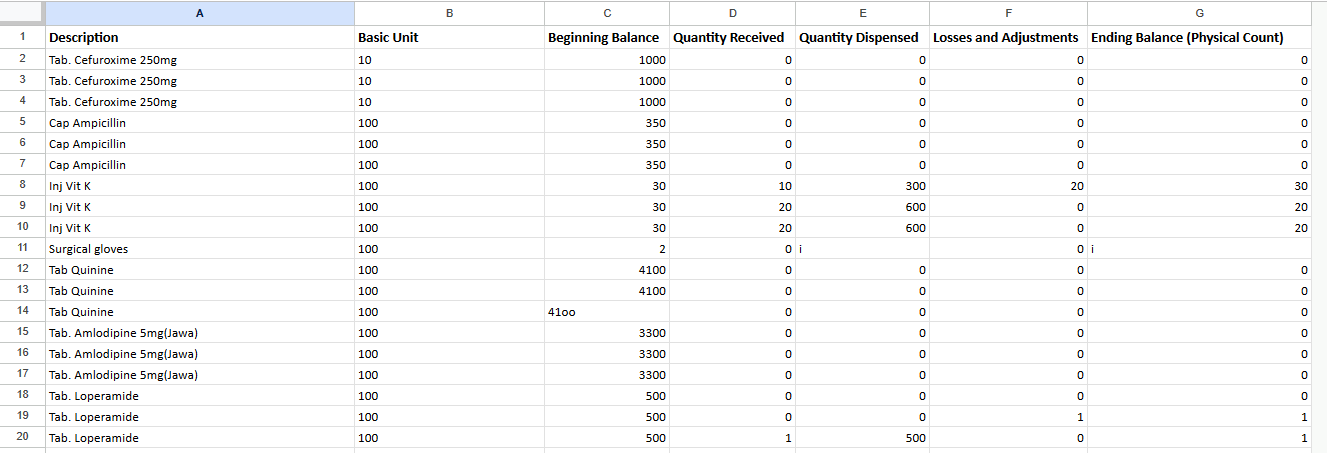
From the above we see certain errors like using o in place of 0 and i in place of 1. Using python we will look through the entire dataset to identify rows where such an error is present.
df.columns
Index(['Description', 'Basic Unit', 'Beginning Balance ', 'Quantity Received ',
       'Quantity Dispensed ', 'Losses and Adjustments',
       'Ending Balance (Physical Count)'],
      dtype='object')
for col in df.columns[2:]:
    df[[not (isinstance(value, int) or isinstance(value, float)) for value in df[col]]]
| Description | Basic Unit | Beginning Balance | Quantity Received | Quantity Dispensed | Losses and Adjustments | Ending Balance (Physical Count) | |
|---|---|---|---|---|---|---|---|
| 12 | Tab Quinine | 100 | 41oo | 0 | 0 | 0 | 0 |
| 3846 | Susp. Erythromycin 125mg/5ml | Bottle | o | 0 | 0 | 0 | 0 |
| Description | Basic Unit | Beginning Balance | Quantity Received | Quantity Dispensed | Losses and Adjustments | Ending Balance (Physical Count) | |
|---|---|---|---|---|---|---|---|
| 490 | Tabs Ibuprofen 200mg | 1000's | 0 | i | 0 | 0 | 1 |
| 491 | Tabs Ibuprofen 200mg | 1000's | 0 | I000 | 0 | 0 | i000 |
| 605 | Tabs Paracetamol 500mg | 1000's | 0 | s | 0 | 0 | 5 |
| 835 | Caps Amoxicillin 500mg | 100's | 0 | 20oo | 0 | 0 | 2000 |
| 1084 | inj Chlorpheniramine 10mg/amp | 100's | 0 | 0.S | 0 | 0 | 0.5 |
| 3812 | Susp. Co-trimoxazole 240mg/5ml | Bottle | 30 | O | 0 | 0 | 30 |
| 4286 | syr Ferric amonium citrate 400mg/5ml | Bottle | 0 | o | 0 | 0 | 0 |
| Description | Basic Unit | Beginning Balance | Quantity Received | Quantity Dispensed | Losses and Adjustments | Ending Balance (Physical Count) | |
|---|---|---|---|---|---|---|---|
| 9 | Surgical gloves | 100 | 2 | 0 | i | 0 | i |
| 1781 | Tab. Loratidine | 100's | 2000 | 0 | o | 0 | 0 |
| 3352 | Hydrogen peroxide | Bottle | 12 | 0 | O | 0 | 12 |
| 3354 | lotion Benzylbenzoate lotion | Bottle | 0 | 0 | o | 0 | 0 |
| Description | Basic Unit | Beginning Balance | Quantity Received | Quantity Dispensed | Losses and Adjustments | Ending Balance (Physical Count) | |
|---|---|---|---|---|---|---|---|
| 2950 | Inj Aminophyline | 50's | 0 | 50 | 0 | O | 50 |
| Description | Basic Unit | Beginning Balance | Quantity Received | Quantity Dispensed | Losses and Adjustments | Ending Balance (Physical Count) | |
|---|---|---|---|---|---|---|---|
| 9 | Surgical gloves | 100 | 2 | 0 | i | 0 | i |
| 491 | Tabs Ibuprofen 200mg | 1000's | 0 | I000 | 0 | 0 | i000 |
| 2508 | Tab. Metformin + Glimepride | 30's | 1300 | 0 | 0 | 0 | O |
| 5062 | Darrows solution 1/2 strength 500ml | Pcs | 0 | 0 | 0 | 0 | o |
The above code is looping through the numerical columns and identifying rows within the columns that contains characters that cannot be converted to float/integers. We see errors present in all five numerical columns within the dataset.
alpha_num_mapping = { 'i': '1',
                        'I': '1',
                        'l': '1',
                        'L': '1',
                        'o': '0',
                        'O': '0',
                        's': '5',
                        'S': '5'}
Based on the errors we have found, the above mapping is created based on the number I assume the letter is supposed to represent.
for col in df.columns[2:]:
    for old, new in alpha_num_mapping.items():
        df[col] = df[col].replace(old, new, regex=True)
    df[[not (isinstance(value, int) or isinstance(value, float)) for value in df[col]]]
| Description | Basic Unit | Beginning Balance | Quantity Received | Quantity Dispensed | Losses and Adjustments | Ending Balance (Physical Count) | |
|---|---|---|---|---|---|---|---|
| 12 | Tab Quinine | 100 | 4100 | 0 | 0 | 0 | 0 |
| 3846 | Susp. Erythromycin 125mg/5ml | Bottle | 0 | 0 | 0 | 0 | 0 |
| Description | Basic Unit | Beginning Balance | Quantity Received | Quantity Dispensed | Losses and Adjustments | Ending Balance (Physical Count) | |
|---|---|---|---|---|---|---|---|
| 490 | Tabs Ibuprofen 200mg | 1000's | 0 | 1 | 0 | 0 | 1 |
| 491 | Tabs Ibuprofen 200mg | 1000's | 0 | 1000 | 0 | 0 | i000 |
| 605 | Tabs Paracetamol 500mg | 1000's | 0 | 5 | 0 | 0 | 5 |
| 835 | Caps Amoxicillin 500mg | 100's | 0 | 2000 | 0 | 0 | 2000 |
| 1084 | inj Chlorpheniramine 10mg/amp | 100's | 0 | 0.5 | 0 | 0 | 0.5 |
| 3812 | Susp. Co-trimoxazole 240mg/5ml | Bottle | 30 | 0 | 0 | 0 | 30 |
| 4286 | syr Ferric amonium citrate 400mg/5ml | Bottle | 0 | 0 | 0 | 0 | 0 |
| Description | Basic Unit | Beginning Balance | Quantity Received | Quantity Dispensed | Losses and Adjustments | Ending Balance (Physical Count) | |
|---|---|---|---|---|---|---|---|
| 9 | Surgical gloves | 100 | 2 | 0 | 1 | 0 | i |
| 1781 | Tab. Loratidine | 100's | 2000 | 0 | 0 | 0 | 0 |
| 3352 | Hydrogen peroxide | Bottle | 12 | 0 | 0 | 0 | 12 |
| 3354 | lotion Benzylbenzoate lotion | Bottle | 0 | 0 | 0 | 0 | 0 |
| Description | Basic Unit | Beginning Balance | Quantity Received | Quantity Dispensed | Losses and Adjustments | Ending Balance (Physical Count) | |
|---|---|---|---|---|---|---|---|
| 2950 | Inj Aminophyline | 50's | 0 | 50 | 0 | 0 | 50 |
| Description | Basic Unit | Beginning Balance | Quantity Received | Quantity Dispensed | Losses and Adjustments | Ending Balance (Physical Count) | |
|---|---|---|---|---|---|---|---|
| 9 | Surgical gloves | 100 | 2 | 0 | 1 | 0 | 1 |
| 491 | Tabs Ibuprofen 200mg | 1000's | 0 | 1000 | 0 | 0 | 1000 |
| 2508 | Tab. Metformin + Glimepride | 30's | 1300 | 0 | 0 | 0 | 0 |
| 5062 | Darrows solution 1/2 strength 500ml | Pcs | 0 | 0 | 0 | 0 | 0 |
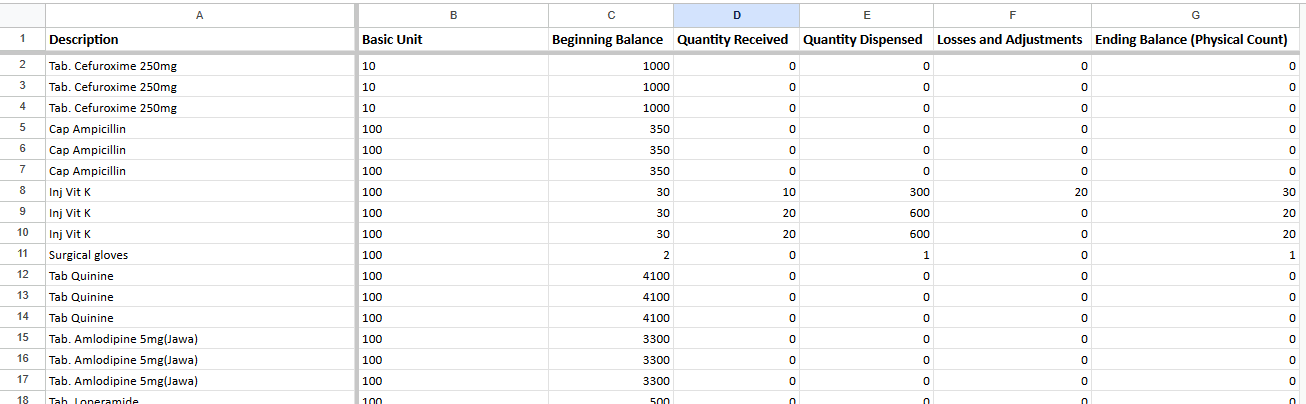
We see that the errors were successfully replaced with their corresponding numbers.
for col in df.columns[2:]:
    df[col] = df[col].astype(float)
    df[[not (isinstance(value, int) or isinstance(value, float)) for value in df[col]]]
| Description | Basic Unit | Beginning Balance | Quantity Received | Quantity Dispensed | Losses and Adjustments | Ending Balance (Physical Count) |
|---|
| Description | Basic Unit | Beginning Balance | Quantity Received | Quantity Dispensed | Losses and Adjustments | Ending Balance (Physical Count) |
|---|
| Description | Basic Unit | Beginning Balance | Quantity Received | Quantity Dispensed | Losses and Adjustments | Ending Balance (Physical Count) |
|---|
| Description | Basic Unit | Beginning Balance | Quantity Received | Quantity Dispensed | Losses and Adjustments | Ending Balance (Physical Count) |
|---|
| Description | Basic Unit | Beginning Balance | Quantity Received | Quantity Dispensed | Losses and Adjustments | Ending Balance (Physical Count) |
|---|
df.info()
<class 'pandas.core.frame.DataFrame'>
RangeIndex: 5846 entries, 0 to 5845
Data columns (total 7 columns):
 #   Column                           Non-Null Count  Dtype
---  ------                           --------------  -----
 0   Description                      5846 non-null   object
 1   Basic Unit                       5846 non-null   object
 2   Beginning Balance                5846 non-null   float64
 3   Quantity Received                5846 non-null   float64
 4   Quantity Dispensed               5846 non-null   float64
 5   Losses and Adjustments           5846 non-null   float64
 6   Ending Balance (Physical Count)  5846 non-null   float64
dtypes: float64(5), object(2)
memory usage: 319.8+ KB
After casting the columns to a float datatype, we see that the same code no longer detects any remaining errors. Additionally, there are no null values in the dataframe and we can assume that the data is now cleaned.
df
| Description | Basic Unit | Beginning Balance | Quantity Received | Quantity Dispensed | Losses and Adjustments | Ending Balance (Physical Count) | |
|---|---|---|---|---|---|---|---|
| 0 | Tab. Cefuroxime 250mg | 10 | 1000.0 | 0.0 | 0.0 | 0.0 | 0.0 |
| 1 | Tab. Cefuroxime 250mg | 10 | 1000.0 | 0.0 | 0.0 | 0.0 | 0.0 |
| 2 | Tab. Cefuroxime 250mg | 10 | 1000.0 | 0.0 | 0.0 | 0.0 | 0.0 |
| 3 | Cap Ampicillin | 100 | 350.0 | 0.0 | 0.0 | 0.0 | 0.0 |
| 4 | Cap Ampicillin | 100 | 350.0 | 0.0 | 0.0 | 0.0 | 0.0 |
| ... | ... | ... | ... | ... | ... | ... | ... |
| 5841 | Inj.Vitamin B Complex | Vial | 145.0 | 30.0 | 4350.0 | 0.0 | 30.0 |
| 5842 | Insulin (Actrapid) | Vial | 0.0 | 0.0 | 0.0 | 0.0 | 0.0 |
| 5843 | Insulin (Insulutard) | Vial | 0.0 | 2.0 | 0.0 | 0.0 | 2.0 |
| 5844 | Inj Amoxicillin 500mg | vials | 54.0 | 100.0 | 79.0 | 0.0 | 75.0 |
| 5845 | Inj Amoxy/clav 1.2 | vials | 7.0 | 0.0 | 7.0 | 0.0 | 0.0 |
5846 rows × 7 columns
4. Invoices with Merged Categories and Merged Amounts
In the final dataset each row is a single transaction and multiple items from the transaction captured within a single column. Our end goal is to convert the dataset into a long format where each item in the transaction will be captured within its own row.
data8 = pd.read_excel('8.-Invoices-with-Merged-Categories-and-Merged-Amounts.xlsx')
df = data8.copy()
df
| Order ID | Category | Amount | |
|---|---|---|---|
| 0 | CA-2011-167199 | Binders | Art | Phones | Fasteners | Paper | 609.98 | 5.48 | 391.98 | 755.96 | 31.12 |
| 1 | CA-2011-149020 | Office Supplies | Furniture | 2.98 | 51.94 |
| 2 | CA-2011-131905 | Office Supplies | Technology | Technology | 7.2 | 42.0186 | 42.035 |
| 3 | CA-2011-127614 | Accessories | Tables | Binders | 234.45 | 1256.22 | 17.46 |
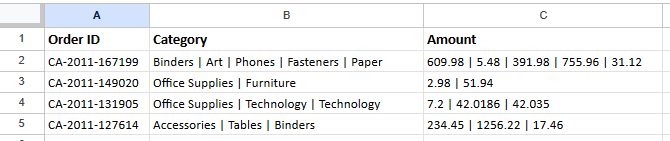
As seen above, the original “dirty” data contains multiple items within “Category” and their corresponding prices within “Amount”. The target end state is to have each of this item on its own row within the dataset.
cleaned_df = df.copy()
cleaned_df.Category = cleaned_df.Category.str.split('|')
cleaned_df.Amount = cleaned_df.Amount.str.split('|')
cleaned_df
| Order ID | Category | Amount | |
|---|---|---|---|
| 0 | CA-2011-167199 | [Binders , Art , Phones , Fasteners , Paper] | [609.98 , 5.48 , 391.98 , 755.96 , 31.12] |
| 1 | CA-2011-149020 | [Office Supplies , Furniture] | [2.98 , 51.94] |
| 2 | CA-2011-131905 | [Office Supplies , Technology , Technology] | [7.2 , 42.0186 , 42.035] |
| 3 | CA-2011-127614 | [Accessories , Tables , Binders] | [234.45 , 1256.22 , 17.46] |
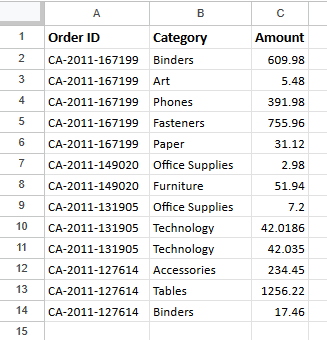
| First we split the two columns by the delimiter | to create a Series of lists each. |
cleaned_df = cleaned_df.explode(['Category','Amount']).reset_index(drop=True)
cleaned_df
| Order ID | Category | Amount | |
|---|---|---|---|
| 0 | CA-2011-167199 | Binders | 609.98 |
| 1 | CA-2011-167199 | Art | 5.48 |
| 2 | CA-2011-167199 | Phones | 391.98 |
| 3 | CA-2011-167199 | Fasteners | 755.96 |
| 4 | CA-2011-167199 | Paper | 31.12 |
| 5 | CA-2011-149020 | Office Supplies | 2.98 |
| 6 | CA-2011-149020 | Furniture | 51.94 |
| 7 | CA-2011-131905 | Office Supplies | 7.2 |
| 8 | CA-2011-131905 | Technology | 42.0186 |
| 9 | CA-2011-131905 | Technology | 42.035 |
| 10 | CA-2011-127614 | Accessories | 234.45 |
| 11 | CA-2011-127614 | Tables | 1256.22 |
| 12 | CA-2011-127614 | Binders | 17.46 |
Using Pandas we are able to explode the columns and achieve our final state without additional code. If we are doing this without pd.explode() it will require some zipping of the lists and reassignments to achieve the same result, which will be harder to implement and will take a longer execution time.
With this we have completed cleaning the 8 different datasets, encountering different ways that data can be “dirty” and how we can tackle each of these different situations. In real world scenarios usually data may come in a combination of being poorly structured and incorrect/incomplete entries, which may significantly increase the difficulty of the cleaning process and requires the analyst to combine multiple techniques to achieve the target end state.